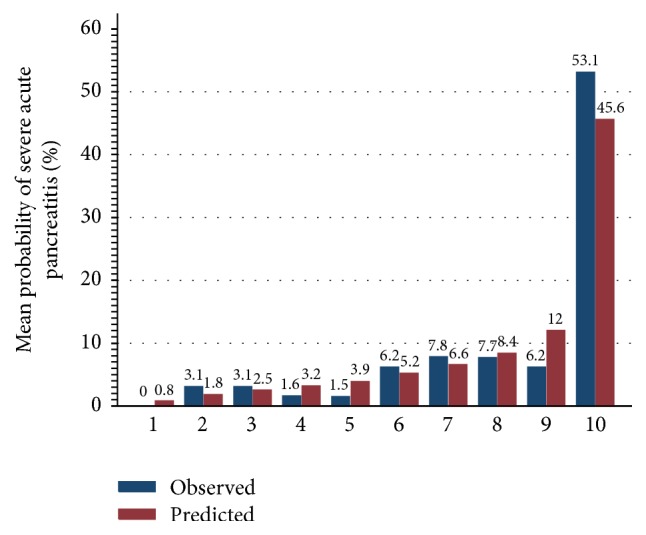
Figure 1.

LR model calibration plot. Patients were ranked by their predicted probability and divided into 10 equal groups. The red bars represent the mean predicted probabilities for each of the 10 groups and blue bars represent the observed probabilities with severe acute pancreatitis in each of these same groups. LR model = logistic regression model.
