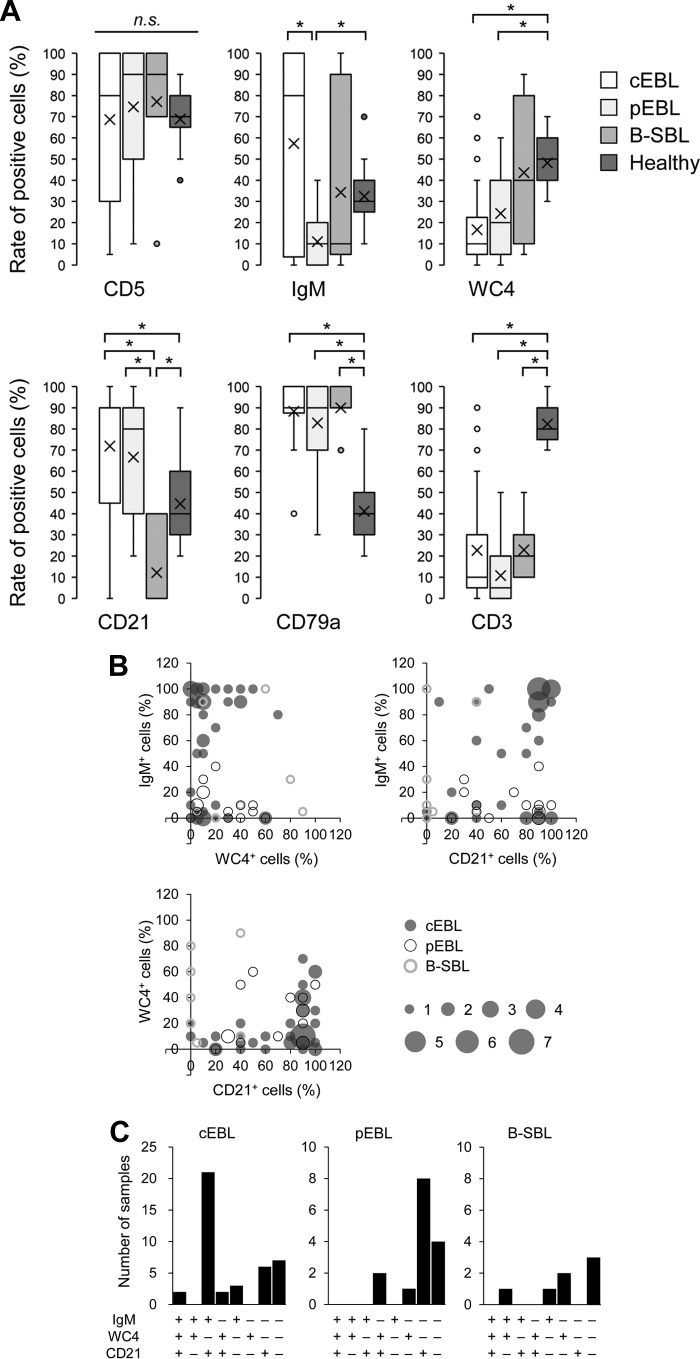
FIG 4.
Immunophenotyping based on expression pattern of cell markers between three B-cell lymphomas and healthy controls. (A) The expression levels of six cell markers in samples with classic enzootic bovine leukosis ([cEBL] n = 42), polyclonal EBL ([pEBL] n = 15), B-cell-type sporadic bovine leukosis ([B-SBL] n = 7), and healthy controls (n = 17) are shown as box-and-whisker plots. Each box indicates the median and lower and upper quartiles and whiskers indicate lower and upper extremes. The “x” marks indicate the averages, and dots represent outliers that are much greater than normal or much less than normal. *, P < 0.05 by Kruskal-Wallis test followed by Steel-Dwass test. (B) Dual expressions of IgM, WC4, and CD21 in cEBL, pEBL, and B-SBL. Each axis indicates the percentages of positive cells, and the bubble size indicates the number of samples which showed identical expression patterns. (C) Triple expression of IgM, WC4, and CD21 in cEBL, pEBL, and B-SBL. +, cell marker expression ≥ 50%; −, cell-marker expression < 50%.

