FIG 5.

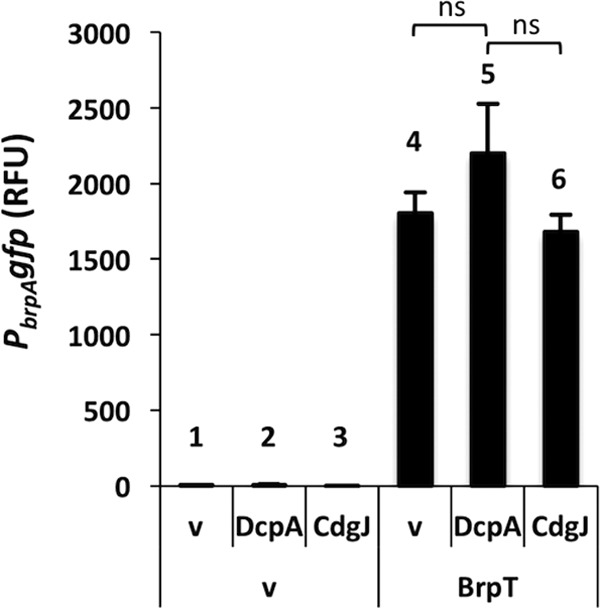
BrpTWT-driven PbrpA expression in E coli. Plots show the means, and error bars represent the standard deviations. Significance: ns, not significant (P > 0.05). RFU, relative fluorescence units. Refer to the text for bar numbering.

BrpTWT-driven PbrpA expression in E coli. Plots show the means, and error bars represent the standard deviations. Significance: ns, not significant (P > 0.05). RFU, relative fluorescence units. Refer to the text for bar numbering.