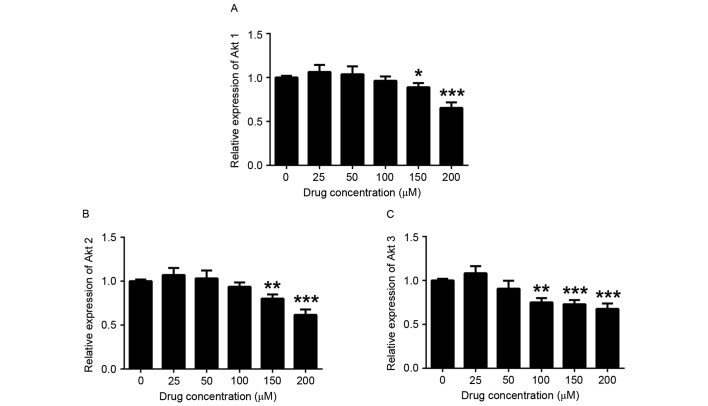
Figure 4.
Cell survival-associated gene expression in THP-1 cells after COR treatment. Reverse-transcription quantitative polymerase chain reaction analysis was employed to detect the expression of (A) Akt1, (B) Akt2 and (C) Akt3 in COR-treated THP-1 cells. Values are expressed as the mean ± standard error. *P<0.05; **P<0.01; ***P<0.001 vs. untreated group. COR, cordycepin.

