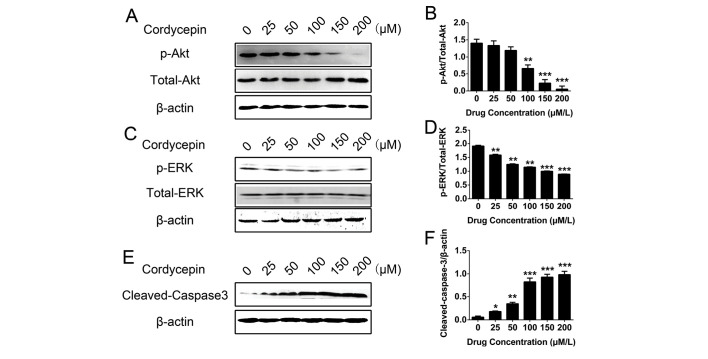
Figure 5.
Western blot analysis of p/total-Akt, p-ERK/total-ERK and cleaved caspase-3 levels following apoptosis induction by COR in THP-1 cells. (A-C) Representative western blot displaying the levels of (A) p/total-Akt, (B) quantified, (C) p-ERK/total-ERK, (D) quantifies, (E) cleaved caspase-3 and, (F) quantified in THP-1 cells following COR treatment. Values were normalized to β-actin. Values are expressed as the mean ± standard error. *P<0.05; **P<0.01; ***P<0.001 vs. untreated group. COR, cordycepin; p-ERK, phosphorylated extracellular signal-regulated kinase.

