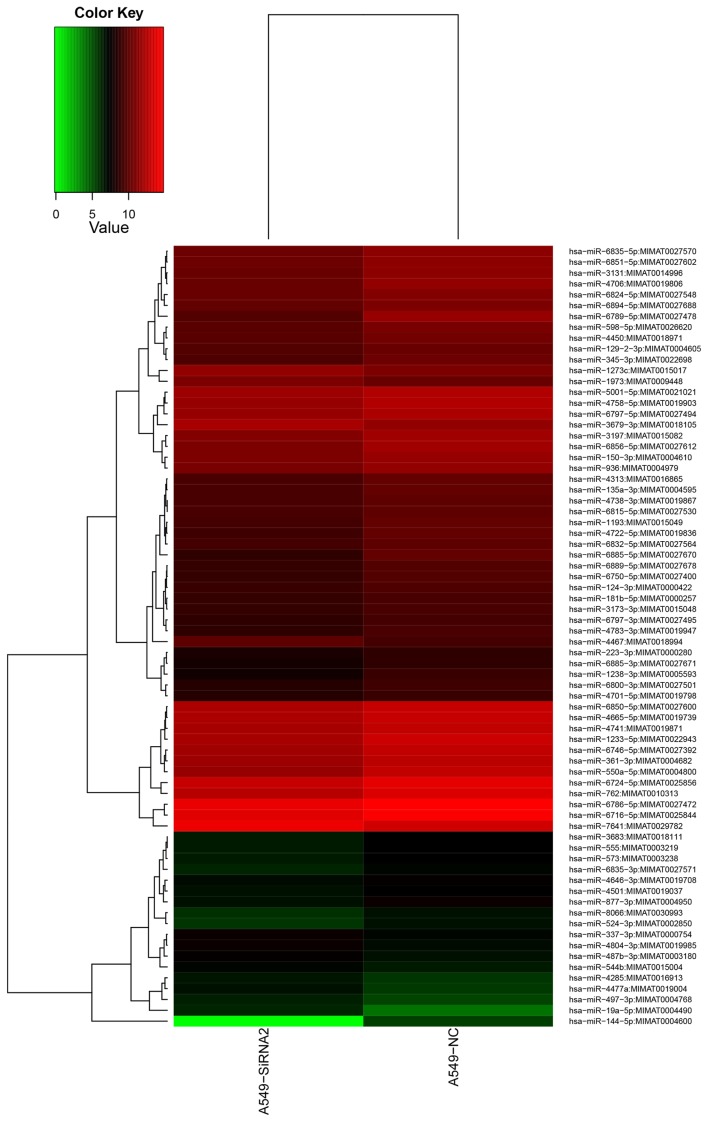
Figure 4.
Heat map clustering of miRNAs expressed in siRNA-2 and negative group. Clustering was performed using Cluster 3.0 software. The colors in the map present the relative values of all tiles within two groups. Red represents up-regulated and green represents down-regulated miRNAs. The brightness of the color indicates the degree of up- or down-regulation.

