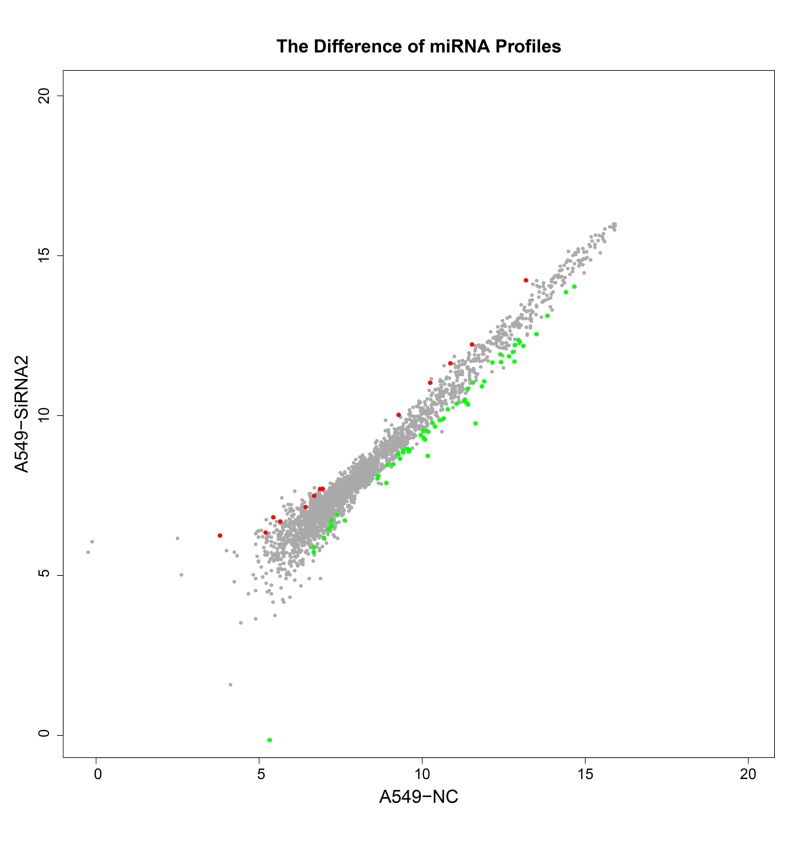
Figure 5.
Scatter plot. The scatter plot was used to assess variation in miRNA expression between the two groups. The values obtained for the X and Y axes in the scatter plot are the normalized signal values determined for the samples (log2 scaled) or the average normalized signal values obtained for the groups of samples (log2 scaled). miRNA, microRNA; siRNA, small interfering RNA; NC, negative control.

