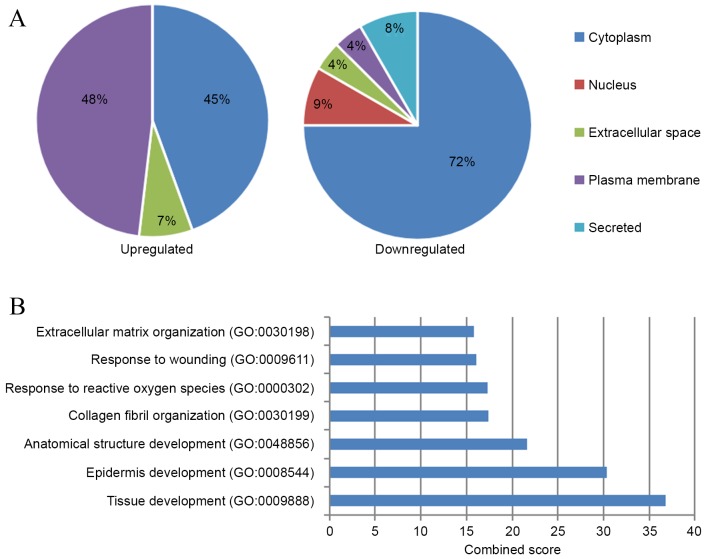
Figure 1.
Subcellular distribution and functional analysis of differentially expressed proteins in PCA. (A) Subcellular distribution of differentially expressed proteins in PCA lesions. Pie charts indicate the percentage of various subcellular locations of upregulated (left) and downregulated (right) proteins. (B) Biological processes that the upregulated proteins in PCA were significantly enriched in (adjusted P<0.001). PCA, primary cutaneous amyloidosis; GO, gene ontology.

