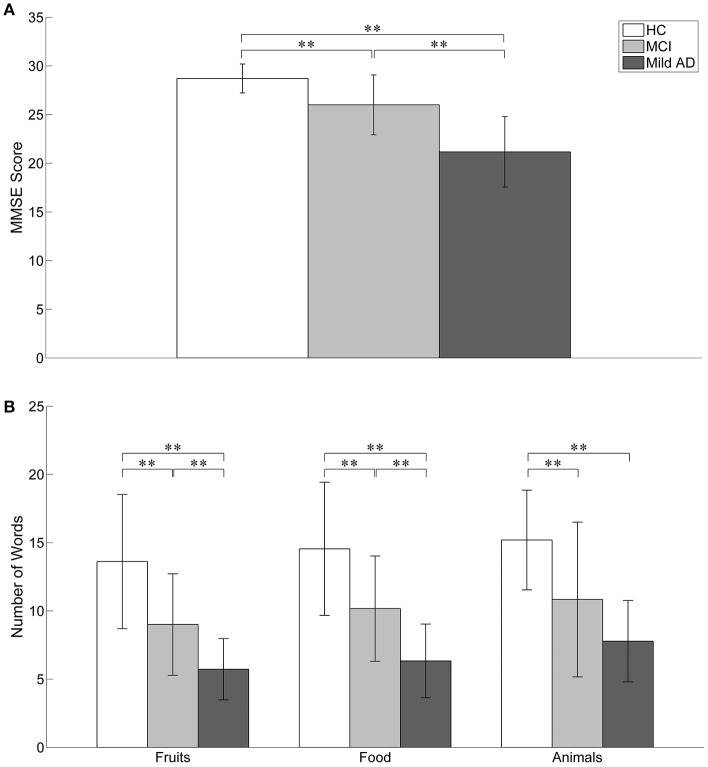
Figure 4.
The behavioral results. Statistical analysis was performed used two-sample t-test. **p < 0.05 with Bonferroni-Holm correction. The error bars represent the standard deviations. (A) The MMSE score of HC was significantly higher than MCI and mild AD. MCI also achieved significant higher MMSE score as compared to mild AD. (B) In the SVFT, the performance was measured by the number of words given. Significant group differences between all three groups were found in the number of words given in “Fruits” and “Food” categories. For “Animals” category, the number of words given by HC was significantly higher than mild AD. In comparison to MCI, HC produced more words but it was not statistically significant. The number of words given by MCI was also higher than mild AD but the difference was not significant.

