
Figure 5.
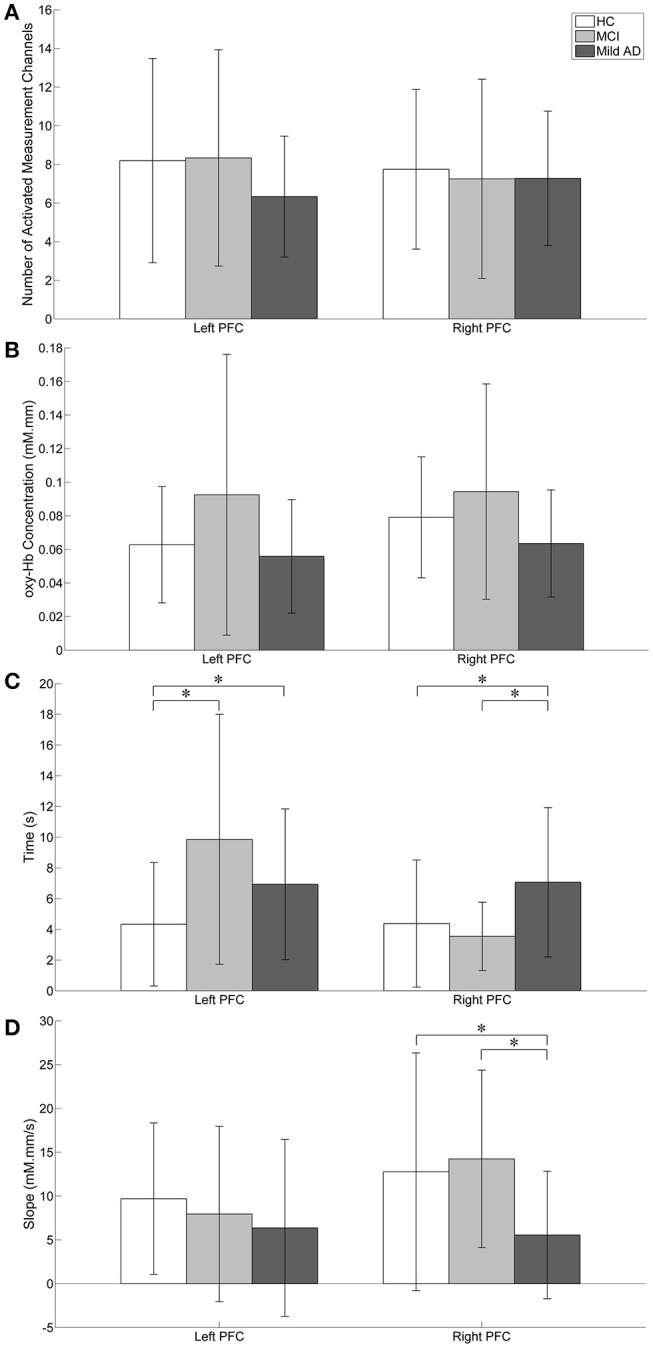
Visual representation of fNIRS data. Statistical analysis was performed used two-sample t-test. *p < 0.05 without multiple testing correction. The error bars represent the standard deviations. (A) The number of activated measurement channels: Nleft PFC/right PFC; there were no significant differences between groups in both the left and right PFC. (B) oxy-Hb concentration change during the activation period: Δoxy − Hbleft PFC/right PFC; Higher activation was observed in MCI followed by HC while mild AD showed the least in both the left and right PFC. The right PFC was more activated than the left PFC in all groups. For both the left and right PFC, there were no significant group differences. (C) Time taken to achieve activation level: tleft PFC/right PFC; HC's tleft PFC was significantly shorter than MCI. (D) Slope in the first 5 s after task onset: mleft PFC/right PFC; in comparison to mild AD, MCI showed significantly steeper mright PFC.