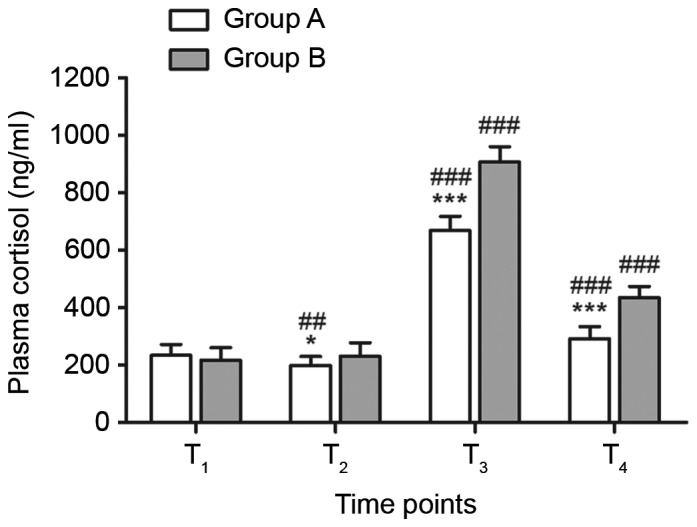
Figure 2.

Comparison of plasma cortisol levels between groups A and B. n=15. *P<0.05 and ***P<0.001 vs. group B; ##P<0.01 and ###P<0.001 vs. T1. T1, at central venous catheterization; T2, 5 min before cardiopulmonary bypass; T3, perioperative; T4, 24 h after operation.
