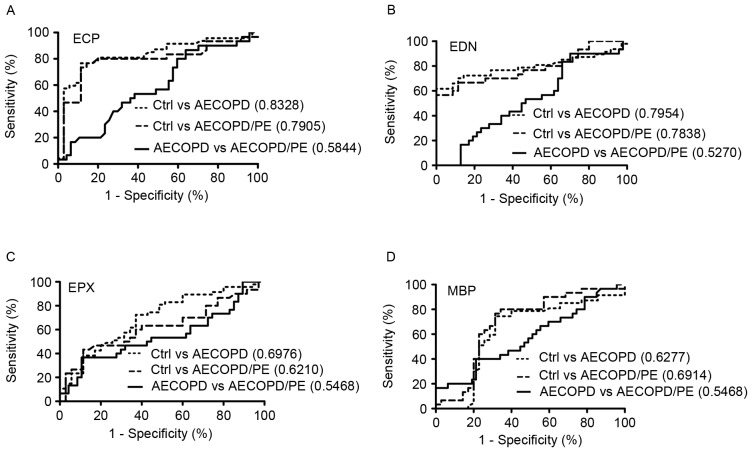
Figure 2.
ROC curves for (A) ECP, (B) EDN, (C) EPX and (D) MBP in the diagnosis of AECOPD with or without PE. The ROC curves illustrate the comparison among patients with AECOPD/PE (n=30), patients with AECOPD (n=47) and normal controls (n=35). The area under each curve is shown in parentheses. ROC, receiver-operating characteristic; ECP, eosinophil cationic protein; EDN, eosinophil-derived neurotoxin; EPX, eosinophil peroxidase; MBP, major basic protein; AECOPD, acute exacerbation of chronic obstructive pulmonary disease; PE, pulmonary embolism; Ctrl, control.

