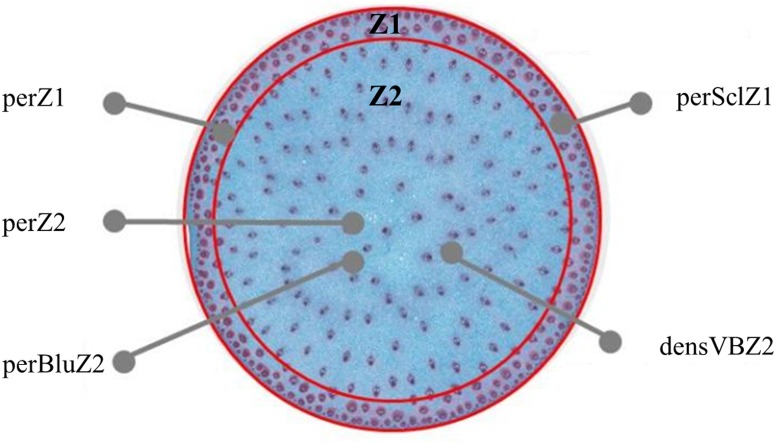
FIGURE 1.
Cross section of sorghum internode, with identification of an outer (Z1) and a central (Z2) zone. Z1 is characterized by its area in % of internode section area (perZ1), the percentage of sclerenchyma tissue (red stained) in % of Z1 area (perSclZ1); Z2 is characterized by its area in % of internode section area, the percentage of blue tissue in percentage of Z2 area (perBluZ2), the density of vascular bundles in Z2 in number of vascular bundles per mm2 (densVBZ2). Example of G1 (Biomass140) in the well-watered treatment in 2013. Coloration by Fasga.

