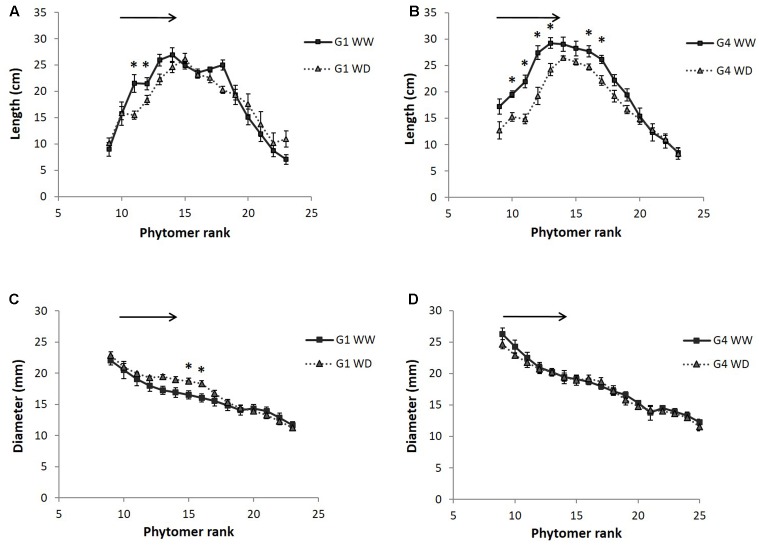
FIGURE 4.
Internode length (A,B) and diameter (C,D) as a function of their rank along the main stem, measured in 2014 field experiment on two hybrids (G1: Biomass140, G4: RE1xAR4) and for two water conditions (WW: well-watered, WD: 1 month of water deficit during stem elongation). Each point on the curve is a mean of 12 internodes with standard error bars. The black arrows indicate internodes having grown during the water deficit period and the black stars internode ranks with significant treatment effects evaluated by ANOVA (p-value < 0.05).

