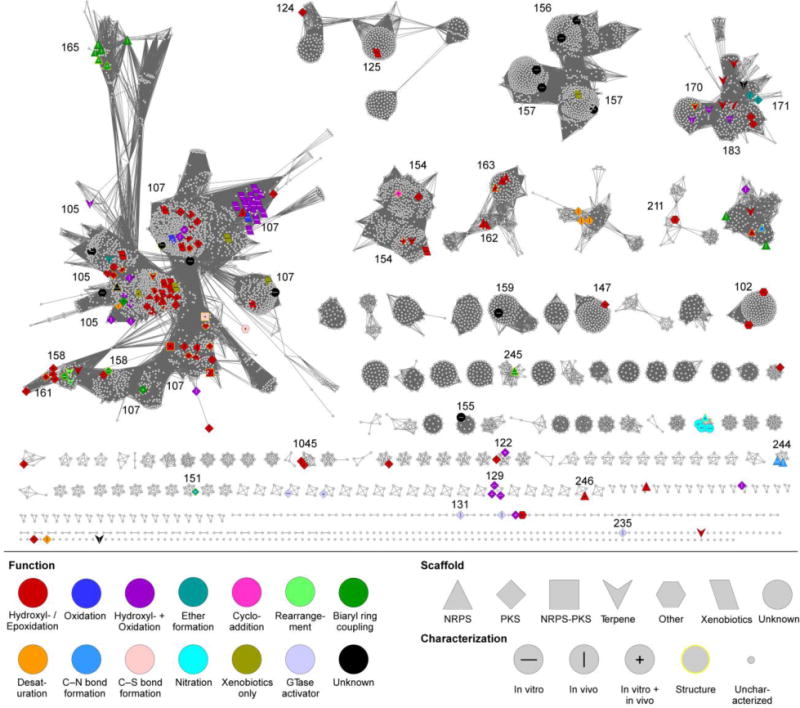
Fig. 5.

CYP family SSN of Streptomyces P450s. The SSN is shown at a BLAST E value cutoff = 10−85 (median 45% identity over 400 residues). Larger nodes are functionally characterized P450s with node labels describing how it was characterized. Colors and shapes of nodes represent P450 function and substrate type (type of natural product scaffold). See inset legend for details. CYP families of functionally characterized P450s are labeled.
