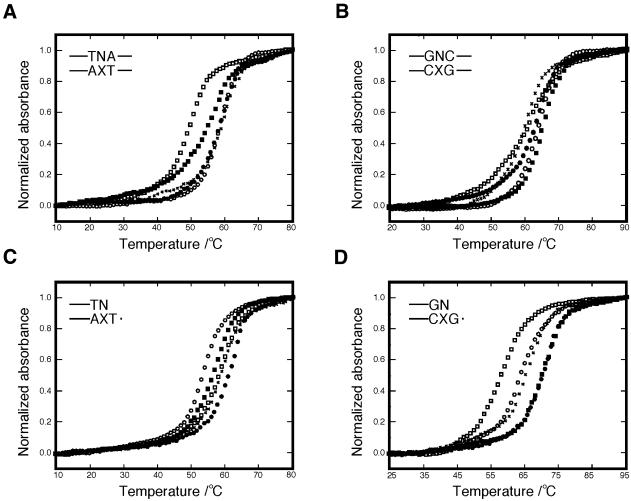
Figure 2.
Normalized UV melting curves. (A–D) Results for duplexes [1], [2], [3] and [4] in Figure 1, respectively. Melting behavior of control duplexes having A–T base pair as X–N are shown as curves drawn by crosses. Melting curves of duplexes with A*–A, A*–G, A*–C and A*–T are drawn by open squares, filled squares, open circles and filled circles, respectively. Each oligomer concentration was 5 µM, and measurements were done in 1 M NaCl-phosphate buffer pH 7.0.

