. 2017 Jun;71(3):198–203. doi: 10.5455/medarh.2017.71.198-203
Copyright: © 2017 Aria Soleimani, Neda Heidari, Mohammad Reza Habibi, Farshad Hasanzadeh Kiabi, Mohammad Khademloo, Amir Emami Zeydi, Fatemeh Bozorg Sohrabi
This is an Open Access article distributed under the terms of the Creative Commons Attribution Non-Commercial License (http://creativecommons.org/licenses/by-nc/4.0/) which permits unrestricted non-commercial use, distribution, and reproduction in any medium, provided the original work is properly cited.
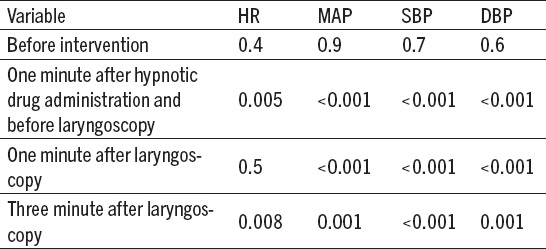
Table 3.
Adjusted mean HR, SBP, DBP and MAP in four measurements in the three groups (SD)

