
Figure 3. Regional plots from combined ancestry GWAS meta-analysis.
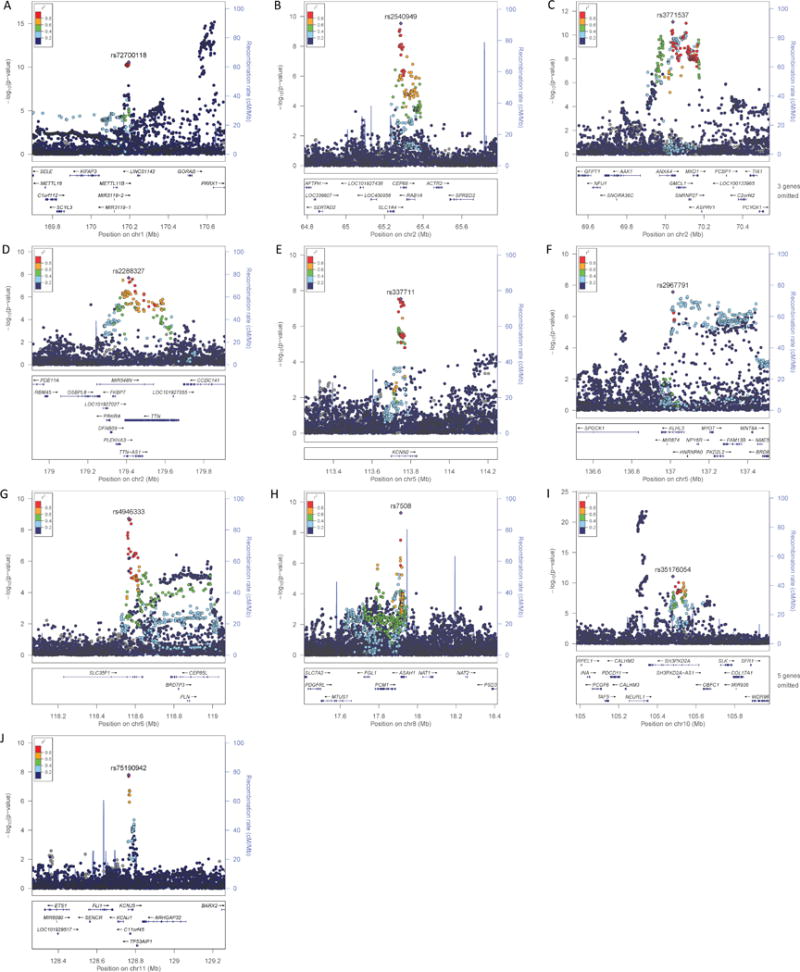
The most significant variant at each locus is plotted (purple, diamond-shaped) and identified with rsID. Each dot in the plots represent a single variant present in our results and the color of the dot indicates the degree of linkage disequilibrium with the most significant variant, as shown on the top left color chart on each panel. The lower part of each panel shows the locations of genes at the respective loci. r2, degree of linkage disequilibrium; chr, chromosome; Mb, megabases; cM, centiMorgan. Regional plots were created using LocusZoom.16