Abstract
The magnetization transfer ratio of the lumbar discs was spatially quantified from age-matched subjects and the nucleus pulposus magnetization transfer ratio was correlated with T2-weighted Pfirrmann grades. A moderate and significant linear correlation between magnetization transfer ratio and Pfirrmann grades was observed, suggesting that nucleus pulposus collagen relative density increases with degeneration. High-resolution axial magnetization transfer ratio maps revealed elevated magnetization transfer ratio in the nucleus pulposa of injured and heavily degenerated discs. In the injured disc, significant elevation in nucleus pulposa magnetization transfer ratio was not accompanied by significant decrease in disc height. This observation may suggest a possible increase in absolute collagen content, in addition to increased collagen relative density. In summary, magnetization transfer MRI of the disc may serve as a noninvasive diagnostic tool for disc degeneration, in addition to other MRI techniques specific to proteoglycan content.
Keywords: Magnetization transfer, intervertebral disc, nucleus pulposus, collagen
INTRODUCTION
The initial stage of intervertebral disc (IVD) degeneration is marked by the breakdown of the proteoglycan (PG) aggrecan in the extracellular matrix of the nucleus pulposus (NP). The loss of PG leads to decreased IVD hydration and hydrostatic pressure (1,2). This process gradually leads to degradation of the annulus fibrosis (AF), which is a collagen-rich lamellar structure that surrounds the NP, resulting in annular tears, rim lesions, and the formation of osteophytes (3–5). Previous studies have utilized noninvasive PG-sensitive techniques such as sodium magnetic resonance imaging (MRI) and T1ρ MRI to study PG depletion in the NP of degenerated IVDs (6,7). However, these studies did not investigate the degenerative changes in IVD collagen, which is the main macromolecular component of the IVD (8), constituting 70% of the AF’s dry weight and 20% of the NP’s dry weight (9).
Both collagen type I and type II fibers contain significant amount of collagen-bound water protons with restricted motion. However, the signals from these protons are difficult to detect due to their rapid spin–spin relaxation mediated by their averaged static dipolar interaction and rotationally modulated dipolar interaction. Thus, conventional MRI techniques such as T1 and T2-weighted imaging with conventional echo time (TE) are insensitive to proton signals from the AF, which makes the visualization and signal quantification of the AF difficult.
Although collagen-bound water protons’ spin magnetization is difficult to be detected directly, their spin magnetization is coupled to that of the free water protons due to magnetization transfer (MT), which allows for the exchange of collagen-bound and free water proton magnetizations according to a pseudo first-order rate equation (10–14). As shown in Fig. 1, the collagen’s restricted protons interact with collagen-bound water protons via cross dipolar relaxation and chemical exchange, resulting in collagen-bound water protons’ short T2 and broad spectral width. Subsequently, the collagen-bound water protons exchange with free water protons through simple diffusion (12). These steps result in the overall coupling of the collagen-bound water protons’ spin-lattice relaxation with the detectable free water protons’ spin-lattice relaxation. This coupling mechanism provides an indirect method to detect signal from the collagen-bound water protons, which is difficult to detect by conventional means.
FIG. 1.
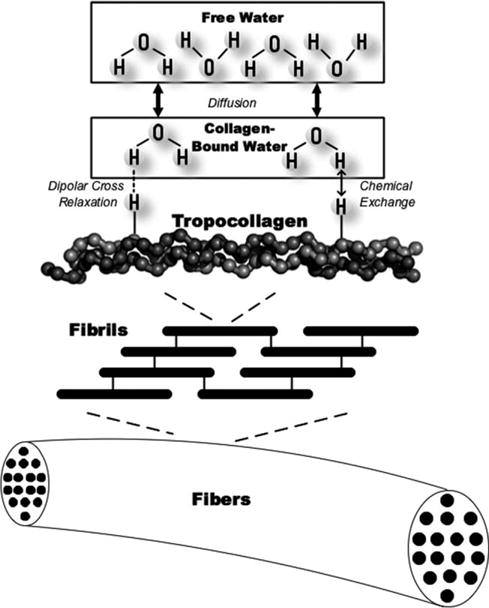
Diagram depiction of the complete proton magnetization transfer mechanism incorporating cross dipolar relaxation, chemical exchange, and proton diffusion. The restricted protons in collagen interact with collagen-bound water protons via dipolar cross relaxation and chemical exchange, which contribute to the broad spectral width of the collagen-bound water protons. The collagen-bound water protons are at the same time in an exchange equilibrium with the free water protons via simple diffusion.
MT phenomenon is observed and quantified with the help of an off-resonance saturation pulse, which selectively saturates the broad spectral width of the collagen-bound water protons and leaves the narrow spectral width of the free water proton relatively unsaturated, as shown in Fig. 2. As the collagen-bound water protons’ frequency spectrum is homogeneously broadened by cross dipolar interaction, the off-resonance saturation results in a decrease of the overall magnetization of the collagen-bound water protons. The MT mechanism dictates that the saturated collagen-bound water protons are in a state of constant exchange with the unsaturated free water protons, which results in the decrease of the detectable free water proton magnetization measured on-resonance.
FIG. 2.
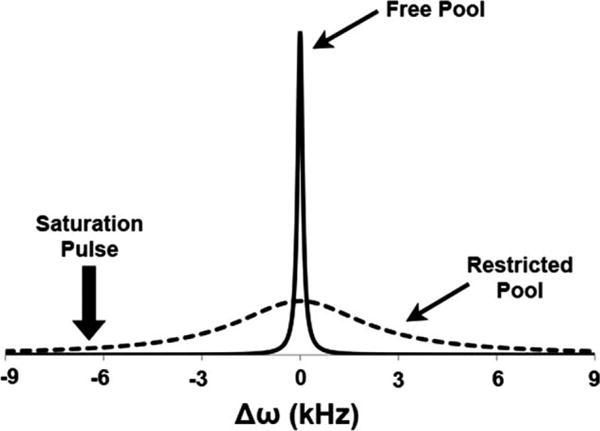
Frequency spectra of the collagen-bound protons with restricted motion (dashed line) and the free water protons (solid line). The placement of the off-resonance saturation pulse is also shown.
It has been suggested that the hydroxyl, amine, and possibly carboxyl groups on the surfaces of macromolecules act as the sites for MT (11). Furthermore, it has been suggested that in cartilage the MT effect is mostly contributed by collagen rather than PG (13,15). The probability of MT has been shown to be proportional to τc/r6, where τc is the motional correlation time of the complex involving the restricted protons in macromolecules and the macromolecule-bound water protons, whereas r is the distance between them (16). For MT to occur efficiently, τc needs to be significantly longer than 10−9 sec (17). Both chemical exchange and dipolar cross relaxation often require long τc sometimes in the microseconds range (11). Collagen fibers in biological tissues are often cross-linked, which makes their τc long enough for MT to take place. It has been demonstrated that the side chain groups on collagen fibers from rat tendon are sufficiently restricted with a correlation time at around 10−8 sec, which is long enough to allow for MT (11). In contrast, PG’s hydroxyl side chains have been shown to be highly mobile by a previous 13C NMR cartilage study (18). The high mobility of PG’s hydroxyl side chains likely results in too short of a τc for MT to occur. Because of the selectivity of the MT effect for collagen, the quantification of the MT phenomenon may lead to the specific quantification of collagen content in biological tissue containing both PG and collagen.
Earlier MT studies of the spine focused on cervical level IVDs, and these experiments were carried out at a low Bo of 0.3 T (19,20). Additional cervical IVD studies focused on MT’s clinical utility as a contrast rather than its quantification and correlation with collagen content (21–23). A previous MT study on cadaveric IVDs confirmed a positive correlation between MT and NP collagen (24). In this study, our primary objective is to validate MT MRI as a noninvasive method for spatial quantification of IVD collagen content in vivo and to use MT MRI to investigate changes in NP collagen content due to IVD degeneration.
MATERIALS AND METHODS
Experimental Protocol
Four human volunteers (mean age = 47 years) were recruited for this study in accordance with the regulations of the Institutional Review Board at our institution. Each subject provided a written consent before the experiment. After consent was obtained, the subjects were instructed to lay supine on a 1.5 T clinical MRI scanner (Sonata Model, Siemens Medical Solutions, Erlangen, Germany). A six-channel spine array RF coil (Siemens) was used to acquire all images. A MT prepared turbo spin echo (TSE) sequence was programmed using the SequenceTree pulse-programming environment (Laboratory for Structural NMR Imaging, Philadelphia, PA). The echo train of each repetition time (TR) was centrically encoded to maximize the MT contrast.
Effects of Off-Resonance Saturation Pulse Duration and B1 on Free Water Proton Magnetization
To determine the optimum parameters for the off-resonance saturation pulse, the free water proton magnetization saturation ratio (Msf/M0f) was simulated using equations previously derived by Eng et al. (12).
| [1] |
| [2] |
| [3] |
Equation 1 was used to simulate the effect of the off-resonance saturation pulse amplitude on the saturation ratio, which was by definition the ratio between longitudinal magnetization of the free water protons with the off-resonance saturation pulse (Msf) and without saturation (M0f). For all parameters, the subscript “f” indicates that the parameter is specific to the free water proton magnetization, whereas the subscript of “r” is specific for macromolecule-bound proton magnetization. The off-resonance frequency of the saturation transfer pulse is denoted by Δω, and it is set to 2, 4, 6.4, and 8 kHz for the following simulations. The proton gyromagnetic ratio is denoted by γ (42.576 MHz/T). τ1f correpsonds to the free water proton longitudinal relaxation with consideration of the magnetization exchange between free and macromolecule-bound water protons (12), as defined by Eq. 2. In this equation, kfor is the pseudo first-order rate constant of MT from free water protons to macromolecule-bound protons. Assuming the proton relaxation parameters T1f = 1.5 sec, T2f = 60 msec, T1r = 1 sec, T2r = 0.2 msec, kfor = 1sec−1(14), the saturation ratio was computed and plotted with B1 as the independent variable for various Δω values as shown in Fig. 3A. This plot demonstrates that the free water proton magnetization saturation increases with B1 field strength at all Δω values. The free proton magnetization saturation increases more rapidly with B1 strength at lower Δω, likely due to the presence of significant direct saturation effect. Equation 3 was used to simulate the effect of the off-resonance saturation pulse duration on the saturation ratio, where t is the saturation pulse duration. Assuming an instantaneous saturation of the macromolecule-bound water proton spins, the free water proton magnetization exponentially decays to a steady-state with a a time constant of 1/τ1f (12). The simulated saturation ratio vs. off-resonance saturation pulse duration data is plotted in Fig. 3B. This plot demonstrates that the saturation ratio decreases as a function of exponential decay of the off-resonance saturation pulse duration until it reaches a steady-state value. Therefore, both the amplitude and duration of the off-resonance saturation pulse should be maximized to observe maximum MT effect. However, in vivo MT MRI protocol is limited by RF specific-absorption-rate, which also increases with both the B1 and the duration of the off-resonance saturation pulse. As a result, the B1 and duration used in the following in vivo imaging protocol were maximized so that the specific-absorption-rate limit was not exceeded for an average-sized adult subject.
FIG. 3.

The relationship between free water proton saturation ratio and B1 field strength at various Δω values is illustrated in the plot in (A). The relationship between free water proton saturation ratio and duration of the off-resonance saturation pulse is illustrated in the plot in (B).
Imaging Protocol
A series of gradient-echo images were first acquired to localize the mid-sagittal slice of each subject’s lumbar and thoracic spine. After localization, MR images were acquired using the previously mentioned MT TSE pulse sequence with the following parameters: TE/TR 13/2000 msec, field of view (FOV) = 25 × 25 cm2, matrix size = 512 × 512, slice thickness = 5 mm, bandwidth = 296 Hz/Pixel, echo train length = 3, signal average = 3. Two images were collected for each subject, one with the MT preparation (Ms) and the other one without it (Mo). The off-resonance saturation pulse was applied at 6.4 kHz down field of the free water proton resonance frequency, at B1 of 200 Hz. The off-resonance saturation pulse was applied in a pulsed fashion with a duration of 150 msec for a TR of 2000 msec. In addition to the sagittal spine images, axial view Ms and Mo images of the L4/L5 and L5/S1 IVDs of two subjects were also acquired.
In Vivo Z-Spectra of the AF and the NP
A single subject underwent MR imaging using the previously described MT TSE pulse sequence, with the off-resonance saturation pulse applied at 17 frequency steps ranging from ±20 kHz. A Mo image of the same subject was also acquired to calculate the saturation ratio (Ms/Mo) at each off-resonance frequency. A single user manually chose a 4-mm-diameter circular ROI in the NP region of the subject’s L4/L5 IVD, along with a 2-mm-diameter circular ROI in the AF region. The same ROIs were applied to the Ms images collected at all 17 frequency steps as well as the Mo image. Afterward the saturation ratio for the NP and the AF compartments at each frequency step was computed. The saturation ratios were plotted against their corresponding off-resonance frequencies, yielding a pair of z-spectra for the NP and the AF compartments of the IVD.
IVD Pfirrmann Grading
Sagittal T2-weigthed MR images of the subjects were acquired on the same MRI scanner using the same Siemens spine-array RF coil and standard TSE pulse sequence. The pulse sequence parameters were as the following: TE/TR = 109/4000 msec, FOV = 28 × 28 cm2, matrix size = 256 × 256, slice thickness = 4 mm, bandwidth = 190 Hz/Pixel, echo train length = 25, signal average = 2. Individual lumbar IVDs (N = 20) were segmented from the images. The segmented IVD images were indexed and randomized. A board-certified radiologist provided clinical assessments and Pfirrmann grades on the segmented IVD images according to the five-point scale described by Pfirrmann et al. (25).
Image Processing and Data Analysis
Subsequent data processing and analysis were carried out using algorithms developed with MATLAB software (MathWorks, Natick, MA). Magnetization transfer ratio (MTR) was computed according to Eq. 4.
| [4] |
This process was repeated on a pixel-by-pixel basis for each pair of sagittal spine Ms and Mo images to yield the MTR maps. A color scale was applied to the MTR maps to enhance their visualization. The IVD regions of the color MTR maps were manually segmented and overlaid on the corresponding grayscale Mo images. From the sagittal MTR map of each IVD, a single user chose a 4-mm diameter circular ROI in the center of the NP. The mean MTR of each ROI was then plotted against the Pfirrmann grade of the IVD. Linear regression analysis was applied to the MTR vs. Pfirrmann grade data. Bivariate correlation of the MTR and Pfirrmann data pairs was carried out, and Pearson correlation coefficient and Spearman’s rank correlation coefficient were computed to determine if there was a direct linear relationship between MTR and Pfirrmann grade in IVD NP. The saturation in the observed saturation image (Ms) is actually consisted of both direct saturation (Mdir) and MT effect (MMT), thus Eq. 4 is expanded to account for these variables, as shown in Eq. 5:
| [5] |
In the in vivo MT imaging protocol, Mdir was minimized by the large off-resonance frequency of 6.4 kHz chosen for the application of the saturation pulse.
RESULTS
Greater signal saturation in the AF was observed after the application of the 6.4 kHz off-resonance saturation pulse, as shown in Fig. 4. The significant signal saturation of the AF compartment is best visualized in the subtraction (difference) image shown in the same figure, in which the anterior and posterior AF both demonstrates higher signal reduction compared with the NP.
FIG. 4.

This figure shows the sagittal Mo and Ms images of the L3/L4 IVD of a representative subject. The difference image (Mo − Ms) of the same L3/L4 IVD is shown on the right. Note the larger signal saturation in the AF compared with the NP.
The saturation pulse was applied at a large off-resonance frequency of 6.4 kHz, to minimize direction saturation and to ensure the observed signal saturation was mainly due to the MT effect. Figure 5 shows the in vivo AF and NP z-spectra from −20 kHz to 20 kHz. At an off-resonance frequency of 6.4 kHz, the z-spectra has shown 36% saturation for the AF and only 14% saturation for the NP. The large difference between the AF and the NP’s saturation ratios not only minimized the direct saturation effect, but also resulted in the largest contrast-to-noise ratio between the AF and NP according to the z-spectra in Fig. 5.
FIG. 5.
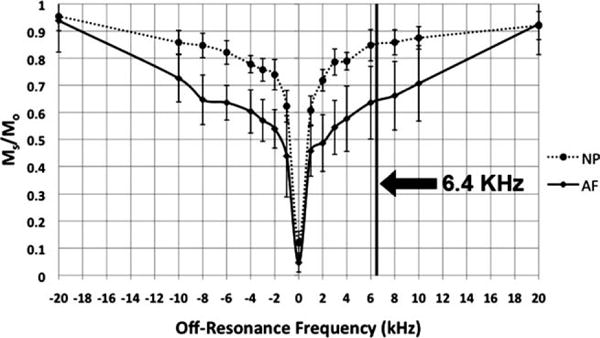
The z-spectra of a subject’s L4/L5 IVD’s AF and NP compartments. The y-axis is the saturation ratio and the x-axis represents the off-resonance frequency of the saturation transfer pulse. The standard deviations of the MTR ROI measurements were graphed as the errors. The vertical line indicates the off-resonance frequency (6.4 kHz) used for all subsequent in vivo MTR map acquisition.
The overlaid MTR maps in Fig. 6 offer clear visualization of the IVD’s AF compartment, along with excellent demarcation between the AF and NP compartments. This observation is the most apparent in the IVDs of the youngest subject (age = 30 years), which are presumably to be mostly healthy with the exception of a posterior herniation in the subject’s L5/S1 IVD. This subject’s healthy IVDs have clear distinction between the AF with high MTR and the NP with low MTR. In contrast, the IVDs of the oldest subject (age = 69 years) no longer exhibit a clear demarcation between the NP and the AF compartments. In addition, the oldest subject’s IVDs show numerous morphological features typical of age-related degeneration, such as significant disc bulges, decreased disc height, and small annular tear. It is also observed that the younger subject’s thoracic level IVD NP has higher MTR values compared with subject’s lumbar IVD NP.
FIG. 6.
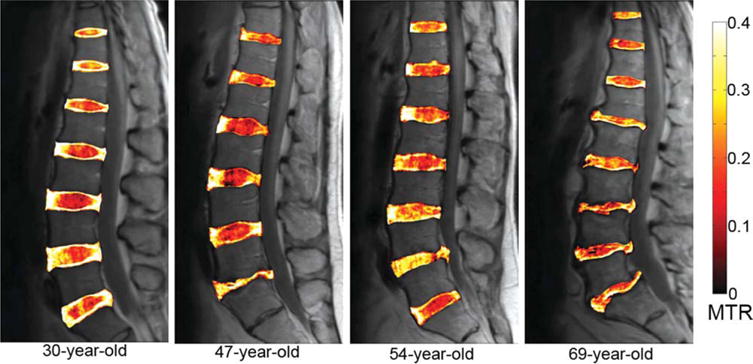
Sagittal MTR color maps overlaid on the grayscale Mo images of four subjects. Note the overall clarity in demarcation between the AF and the NP compartments in the IVDs of the 30-year-old subject when compared with those of the 69-year-old subject. Also note the elevated NP MTR measurements in the L5/S1 IVD of the 47-year-old subject and in the L4/L5 IVD of the 54-year-old subject.
In Fig. 7A, the older subject’s L2/L3 IVD NP contains punctuate spots of high MTR values when compared with that of the younger subject. The anterior-to-posterior MTR value profiles of these two subjects’ IVDs (Fig. 7B) also demonstrate the older subject’s IVD’s increased NP MTR heterogeneity, as well as the lack of a clear MTR value difference between the AF and NP compartments.
FIG. 7.
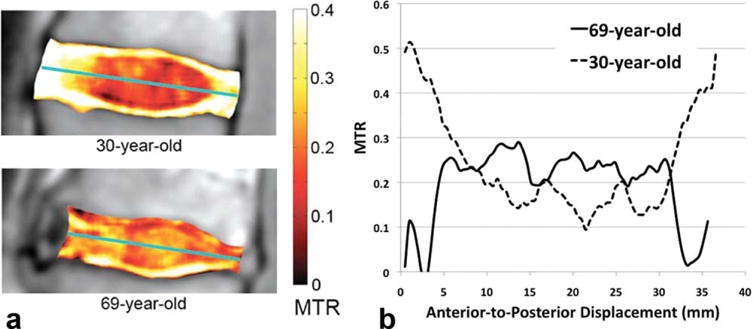
A: The MTR maps of the L2/L3 IVDs overlaid on top of the grayscale Mo images for a pair of young and old subjects. B: The anterior-to-posterior MTR profiles of the same IVDs shown in (A), the profiles were computed along the axes denoted by the green lines in (A).
Figure 8 contains the scatter plot of the NP MTR vs. Pfirrmann grade data. The dashed line marks the linear regression fit of the data points. A one-tailed bivariate correlation analysis of the NP MTR vs. Pfirrmann grade data yields a moderate but significant Pearson correlation coefficient of 0.652 at a significance level of P < 0.01, as well as a moderate but significant Spearman’s rank correlation coefficient of 0.568 at a significance level of P < 0.01.
FIG. 8.
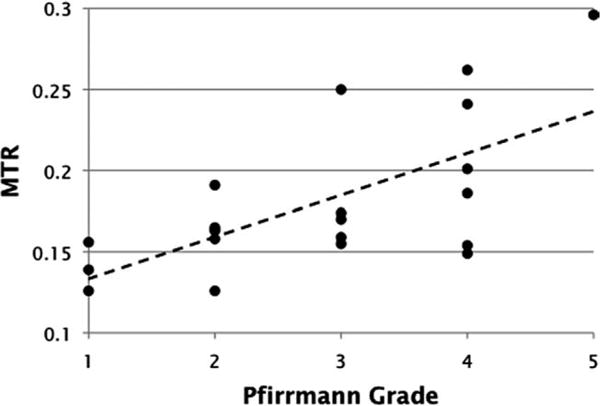
A scatter plot of lumbar IVD NP MTR measurements vs. Pfirrmann grades assigned by a board-certified radiologist. Linear regression fit of the data are graphed as the dashed line.
The L5/S1 IVD of the 47-year-old subject and the L4/L5 IVD of the 54-year-old subject both exhibit significantly elevated MTR values in the NP regions. As the MTR values of these IVDs were not consistent with those of other IVDs in the same subjects, axial MTR maps of these IVDs were obtained. The corresponding axial MTR maps were computed, segmented, and overlaid on the grayscale Mo images. In Fig. 9, the 47-year-old subject’s healthy L4/L5 MTR color map is shown on the right, whereas the L5/S1 MTR color map is shown on the right. In these MTR maps, the L4/L5 IVD has clear boundary between the AF and NP compartments, with significantly elevated MTR value in the AF. In contrast, the MTR map of the L5/S1 IVD shows significantly elevated MTR value in the central NP region. This L5/S1 IVD received a grade of five on the Pfirrmann scale. In addition, the radiologist reported from the corresponding T2-weighted image that this IVD’s adjacent endplates underwent remodeling, showing signs of inflammation and fat deposits. These symptoms are typical to late-stage IVD degeneration. In Fig. 10, the 54-year-old subject’s degenerated L4/L5 and healthy L5/S1 MTR color maps are shown. Radiological report from the T2-weighted image of this subject revealed significant IVD bulge from the L4/L5 IVD. In accordance with the radiological report, the MTR map of this IVD shows elevated MTR value in the center NP region, which displaces tissues with low MTR value toward the posterior side of the IVD.
FIG. 9.
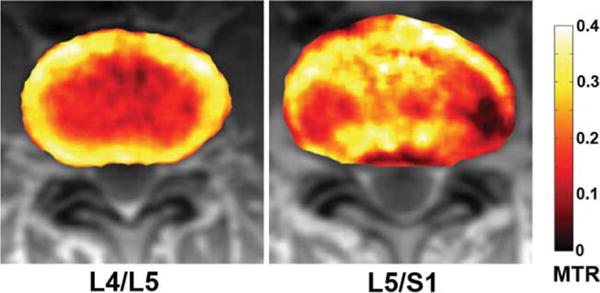
Axial color IVD MTR maps overlaid on top of the Mo IVD images of the 47-year-old subject. The L4/L5 IVD appears to be the healthier IVD.
FIG. 10.
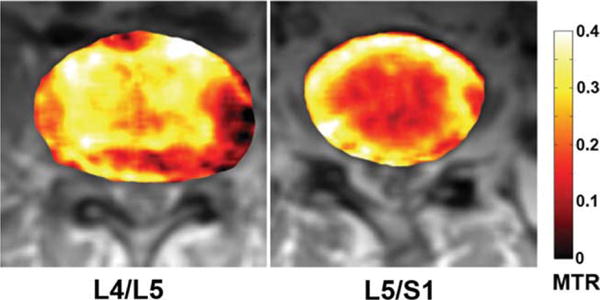
Axial color IVD MTR maps overlaid on top of the Mo IVD images of the 54-year-old subject. The L5/S1 IVD appears to be the healthier IVD.
DISCUSSION AND CONCLUSIONS
An earlier in vivo MT MRI study of human cadaveric lumbar IVD concluded a positive correlation between MT and collagen content (24). However, this study was conducted at a Bo field of 0.1 T. At such low Bo, the inherent low image SNR hinders the quantitative analysis of the images. More importantly, by conducting the MT experiment at a higher Bo field of 1.5 T, the comparatively shorter T2 of the collagen-bound protons cause additional broadening of their frequency spectra. This broadening of the collagen-bound protons’ frequency spectrum has allowed us to apply the saturation transfer pulse at a large off-resonance frequency (6.4 kHz), which minimized the saturation pulse’s direct saturation effect on the free water proton spin magnetization. Higher Bo field of 3 T would cause further broadening of the collagen-bound proton’s frequency spectrum. However, the higher Bo field of 3 T also increases the off-resonance saturation pulse’s power requirement, which would force reduction in both the saturation pulse amplitude and duration due to specific-absorption-rate restriction. Therefore, this study was carried out on a 1.5 T MRI scanner to achieve adequate MT effect with acceptable specific-absorption-rate.
The AF’s higher saturation (36%) at 6.4 kHz observed from its z-spectrum in Fig. 5 was most likely due to the AF’s significantly higher collagen content than the NP. This observation corroborates the result of a previous study showing that collagen constitutes 70% of the dry weight of the AF and only 20% of the dry weight of the NP (9). The other NP biomolecules such as elastin, fibronectin, and amyloid may also contribute to the observed MT effect. However, as these biomolecules are present only in small quantities compared to PG, collagen, and water, which together make up the overwhelming majority of the NP content, it is likely that the MT effect in IVD is primarily contributed by the presence of collagen. It is important to note that the MTR value in degenerated IVDs may be decreased by collagen denaturation. Previous studies have concluded a positive relationship between IVD collagen denaturation and degeneration (1,26). Moreover, denaturation of collagen has been shown to slightly decrease the MT effect (27). Therefore, collagen denaturation in degenerated IVD could potentially contribute a small reduction in the elevated MTR value associated with increased NP relative collagen density.
Because there was significant difference in absolute collagen content in the AF and the NP compartments (70% and 20% dry weight, respectively), the observed NP saturation (14%) appears to be unproportionally high when compared with the AF saturation (36%). The NP collagen content consists of mostly fine type II collagen fibers (28), which are randomly oriented (29). A previous study has shown that type II collagen fibers form crosslinks in fibrocartilage (30), and the formation of type II collagen cross-links has been shown to increase MT effect (31), recall that the likelihood of MT is proportional to τc/r6, where τc is the molecular correlation time of the complex composed of the restricted protons in macromolecules and macromolecule-bound protons (16). In cross-linked type II collagen fibers, τc is likely to increase because the cross-links slow the molecular motion of type II collagen fibers. Therefore, the likelihood of MT is increased in cross-linked type II collagen fibers of the NP, which contributed to a fraction of the observed 14% NP signal saturation after the application of the 6.4 kHz off-resonance saturation pulse.
Another factor that may have contributed to the elevated NP signal saturation is the direct saturation effect of the off-resonance saturation pulse. As the relatively small amount of type II collagen fibers in the NP are loosely packed, they contain significant intrafibrillar water content (32). The motionally restricted characteristic of intrafibrillar water protons results in a broader frequency spectrum when compared with that of the free water protons. The broad spectral width makes the intrafibrillar water proton magnetization prone to direct saturation from the saturation pulse applied at a given off-resonance frequency. Therefore, the observed 14% NP saturation ratio may contain a direct saturation component.
The difference in NP MTR value between the thoracic and the lumbar IVDs of the youngest subject observed from Fig. 6 was likely due to the difference in thoracic and lumbar IVD NP type II collagen contents. The higher NP MTR in thoracic IVDs indicated the presence of higher collagen content. This observation corroborates a previous study that concluded higher collagen content in the thoracic IVD NP compared with that of the lumbar IVD NP (9).
The observed punctuate spots of high MTR values in the NP of the older subject in Fig. 7 suggest possible increased collagen in the older subject’s IVD NPs. However, this increase in NP MTR in combination with the decreased disc height suggests that while the absolute collagen content in these IVD NPs may not have changed significantly, the relative density of collagen has increased due to the depletion of water and PGs. A previous ex vivo study on the macroscopic changes of IVD NP from aging has shown definite progression of the NP from a highly hydrated gel-like tissue to a fibrous material indistinguishable from the AF (33). However, this NP fibrosis progression pattern due to IVD degeneration has yet to be demonstrated in a quantitative fashion in vivo. As the current standard assessment for IVD degeneration is based on T2-weighted MR images and the Pfirrmann grade, we correlated the IVD NP MTR measurements with Pfirrmann grade. The moderate but significant correlation between MTR and Pfirrmann grade suggests that the MTR indeed increases with IVD degeneration. The correlation is only moderate because the Pfirrmann grade is not a quantitative measurement of any particular macromolecular component of the IVD, instead it depends on qualitative observations such as disc height, hydration, and other morphological features. These grading criteria of the Pfirrmann grade do not necessarily result in numerical grades that fall along a linear timescale of IVD degeneration. Moreover, Pfirrmann grade can be prone to intrapersonal and interpersonal biases. In contrast to the Pfirrmann grade, the in vivo MT MRI protocol described in this study is based on quantitative measurement with specificity for IVD macromolecular composition. However, as Pfirrmann grade is an accepted measure of IVD degeneration, a positive relationship between NP MTR and Pfirrmann grade, as demonstrated here, indicates that NP collagen content indeed increases with degeneration.
In the axial MTR maps shown in Fig. 9, the L5/S1 IVD shows significantly elevated MTR value in the central NP region. This observation along with the decreased disc height observed from FIG. 6 suggests an increase in the relative density of NP collagen. In Fig. 10, the L4/L5 IVD also shows elevated MTR value in the center NP region. However, the relatively normal disc height combined with the elevated MTR value in the NP region of this IVD suggests a possible increase in the absolute collagen content of the NP. However, without additional information, it is difficult to determine whether this increase in NP collagen is a transient phase of aging-related IVD degeneration or a specific trauma-induced fibrosis mechanism that is intended to stabilize an injured IVD, and to temporarily maintain its load-resisting property. This question can only be addressed with a longterm study using a large subject population. Regardless of whether the absolute collagen content increases in IVD degeneration, the increase in collagen relative density may reconcile the paradox in fibro-cartilage degeneration. Both articular cartilage and IVD belong to the same family of fibrocartilage composed of collagen and PG. Yet in articular cartilage, degenerated tissue exhibits increased T2 and T1ρ relaxation time constants (34–36). Although in IVD NP, degeneration leads to decreased T2 and T1ρ relaxation time constants (6,37,38). When articular cartilage degrades, PGs leave the type II collagen extracellular matrix, and the vacated space is thus infiltrated with fluid, resulting in elevated T2 and T1ρ relaxation time constants. In contrast, the loosely packed type II collagen extracellular matrix in IVD NP is not as readily infiltrated with fluid during degeneration, as both PG depletion and decreased IVD volume hinder the infiltration of fluid. Even when annular tears and fissures offer access to the degenerated NP, the lack of water-attracting PGs and collapsed disc space still prevent significant fluid infiltration. This process leads to the overall dehydration of degenerated IVDs (39). The results from this study confirm that typical IVD degeneration causes an increase in NP relative collagen density, which could account for the lower T2 and T1ρ relaxation time constants typically observed in degenerated IVDs (6,38).
In conclusion, our study demonstrated that the MT effect in IVD is mostly dominated by the collagen content. In a healthy IVD, the MTR is the highest in the collagen-rich AF. However, because of aging-related degeneration, we observed elevated MTR in the NP region of the IVD. To determine the relationship between MTR and IVD degeneration, we statistically determined a moderate but significant linear relationship between IVD NP MTR values and Pfirrmann grades. Thus, it was concluded that relative density of NP collagen increases with IVD degeneration. In addition, IVD MTR map’s significant contrast-to-noise ratio between AF and NP compartments makes it ideal for accurate segmentation of the NP and AF compartments. To the best of our knowledge, this study represents the first attempt of validating MTR mapping as a tool for quantifying collagen content in lumbar IVDs in vivo and also the first attempt to determine lumbar IVD NP relative collagen density change due to degeneration in vivo. Aging-related IVD degenerative changes are similar to the symptoms of degenerative disc disease, thus it is difficult to differentiate between IVD degeneration due to aging and IVD degeneration due to pathological processes (40). It is not yet clear at the moment whether aging and degenerative disc disease are unique processes or an identical process occurring over different timescales. A longitudinal study involving a large patient pool with age-matched controls is required to investigate this topic. However, by establishing that MT MRI can be used to evaluate IVD collagen content in vivo, it can then be used in conjunction with PG-sensitive MRI techniques to study IVD degeneration in vivo, and to shed additional light on the exact mechanism of IVD degeneration. In return, a more thorough understanding of IVD degeneration will promote the development of treatments and therapeutics aimed at halting or even reversing the degenerative process.
Acknowledgments
Grant sponsor: NIH-NCRR; Grant numbers: RR02305, NIHR01AR45404, and NIHR01AR051041; Grant sponsor: NIBIB T32 Training Grant; Grant number: T32-EB000814; Grant sponsor: AO Spine Research Grant; Grant number: AOSBRC-07-05.
References
- 1.Antoniou J, Steffen T, Nelson F, Winterbottom N, Hollander AP, Poole RA, Aebi M, Alini M. The human lumbar intervertebral disc: evidence for changes in the biosynthesis and denaturation of the extracellular matrix with growth, maturation, ageing, and degeneration. J Clin Invest. 1996;98:996–1003. doi: 10.1172/JCI118884. [DOI] [PMC free article] [PubMed] [Google Scholar]
- 2.Urban JP, McMullin JF. Swelling pressure of the lumbar intervertebral discs: influence of age, spinal level, composition, and degeneration. Spine. 1988;13:179–187. doi: 10.1097/00007632-198802000-00009. [DOI] [PubMed] [Google Scholar]
- 3.Marchand F, Ahmed AM. Investigation of the laminate structure of lumbar disc anulus fibrosus. Spine. 1990;15:402–410. doi: 10.1097/00007632-199005000-00011. [DOI] [PubMed] [Google Scholar]
- 4.Andersson GB. What are the age-related changes in the spine? Baillieres Clin Rheumatol. 1998;12:161–173. doi: 10.1016/s0950-3579(98)80010-1. [DOI] [PubMed] [Google Scholar]
- 5.Kirkaldy-Willis WH, Wedge JH, Yong-Hing K, Reilly J. Pathology and pathogenesis of lumbar spondylosis and stenosis. Spine. 1978;3:319–328. doi: 10.1097/00007632-197812000-00004. [DOI] [PubMed] [Google Scholar]
- 6.Auerbach JD, Johannessen W, Borthakur A, Wheaton AJ, Dolinskas CA, Balderston RA, Reddy R, Elliott DM. In vivo quantification of human lumbar disc degeneration using T(1Rho)-weighted magnetic resonance imaging. Eur Spine J. 2006;15(SUPPL 15):338–344. doi: 10.1007/s00586-006-0083-2. [DOI] [PMC free article] [PubMed] [Google Scholar]
- 7.Insko EK, Clayton DB, Elliott MA. In vivo sodium mr imaging of the intervertebral disk at 4 T. Acad Radiol. 2002;9:800–804. doi: 10.1016/s1076-6332(03)80350-1. [DOI] [PubMed] [Google Scholar]
- 8.Comper WD. Extracellular matrix: molecular components and interactions. Amsterdam, The Netherlands: Harwood Academic Publishers; 1996. [Google Scholar]
- 9.Eyre DR, Muir H. Quantitative analysis of types i and ii collagens in human intervertebral discs at various ages. Biochim Biophys Acta. 1977;492:29–42. doi: 10.1016/0005-2795(77)90211-2. [DOI] [PubMed] [Google Scholar]
- 10.Edzes HT, Samulski ET. Cross relaxation and spin diffusion in the proton nmr or hydrated collagen. Nature. 1977;265:521–523. doi: 10.1038/265521a0. [DOI] [PubMed] [Google Scholar]
- 11.Ceckler TL, Wolff SD, Yip V, Simon SA, Balaban RS. Dynamic and chemical factors affecting water proton relaxation by macromolecules. J Magn Reson. 1992;98:637–645. [Google Scholar]
- 12.Eng J, Ceckler TL, Balaban RS. Quantitative H-1 magnetization transfer imaging invivo. Magn Reson Med. 1991;17:304–314. doi: 10.1002/mrm.1910170203. [DOI] [PubMed] [Google Scholar]
- 13.Kim DK, Ceckler TL, Hascall VC, Calabro A, Balaban RS. Analysis of water-macromolecule proton magnetization transfer in articular cartilage. Magn Reson Med. 1993;29:211–215. doi: 10.1002/mrm.1910290209. [DOI] [PubMed] [Google Scholar]
- 14.Wolff SD, Balaban RS. Magnetization transfer contrast (MTC) and tissue water proton relaxation in vivo. Magn Reson Med. 1989;10:135–144. doi: 10.1002/mrm.1910100113. [DOI] [PubMed] [Google Scholar]
- 15.Laurent D, Wasvary J, Yin J, Rudin M, Pellas TC, O’Byrne E. Quantitative and qualitative assessment of articular cartilage in the goat knee with magnetization transfer imaging. Magn Reson Imaging. 2001;19:1279–1286. doi: 10.1016/s0730-725x(01)00433-7. [DOI] [PubMed] [Google Scholar]
- 16.Noggle JH, Schirmer RE. The nuclear overhauser effect; chemical applications. New York: Academic Press; 1971. p. XI, 259. [Google Scholar]
- 17.Ceckler TL, Karino K, Kador PF, Balaban RS. Magnetic-resonance-imaging of the rabbit eye improved anatomical detail using magnetization transfer contrast. Invest Ophthalmol Visual Sci. 1991;32:3109–3113. [PubMed] [Google Scholar]
- 18.Torchia DA, Hasson MA, Hascall VC. Investigation of molecular motion of proteoglycans in cartilage by 13C magnetic resonance. J Biol Chem. 1977;252:3617–3625. [PubMed] [Google Scholar]
- 19.Yoshioka H, Nishimura H, Masuda T, Nakajima K, Onaya H, Itai Y. Magnetization transfer contrast imaging of the cervical spine at 0.3 T. J Comput Assist Tomograph. 1994;18:947–953. doi: 10.1097/00004728-199411000-00020. [DOI] [PubMed] [Google Scholar]
- 20.Yoshioka H, Onaya H, Itai Y, Nishimura H, Matsumura A, Tsunoda T, Kandatsu S, Koga M, Yoshikawa K, Kato H, Tsujii H. Comparison between magnetization transfer contrast and fast spin-echo MR imaging of degenerative disease of the cervical spine at 0.3 T. Magn Resonan Imaging. 1997;15:37–45. doi: 10.1016/s0730-725x(96)00247-0. [DOI] [PubMed] [Google Scholar]
- 21.Melhem ER, Benson ML, Beauchamp NJ, Lee RR. Cervical spondylosis: three-dimensional gradient-echo MR with magnetization transfer. AJNR Am J Neuroradiol. 1996;17:705–711. [PMC free article] [PubMed] [Google Scholar]
- 22.Melhem ER, Bert RJ, Faddoul SG. Cervical spondylosis: contrast-enhanced magnetization transfer prepulsed 3D turbo field echo MR imaging. J Magn Reson Imaging. 2000;11:294–298. doi: 10.1002/(sici)1522-2586(200003)11:3<294::aid-jmri8>3.0.co;2-u. [DOI] [PubMed] [Google Scholar]
- 23.Melhem ER, Caruthers SD, Jara H. Cervical spine: three-dimensional MR imaging with magnetization transfer prepulsed turbo field echo techniques. Radiology. 1998;207:815–821. doi: 10.1148/radiology.207.3.9609910. [DOI] [PubMed] [Google Scholar]
- 24.Paajanen H, Komu M, Lehto I, Laato M, Haapasalo H. Magnetization-transfer imaging of lumbar disc degeneration—correlation of relaxation parameters with biochemistry. Spine. 1994;19:2833–2837. doi: 10.1097/00007632-199412150-00018. [DOI] [PubMed] [Google Scholar]
- 25.Pfirrmann CW, Metzdorf A, Zanetti M, Hodler J, Boos N. Magnetic resonance classification of lumbar intervertebral disc degeneration. Spine. 2001;26:1873–1878. doi: 10.1097/00007632-200109010-00011. [DOI] [PubMed] [Google Scholar]
- 26.Hollander AP, Heathfield TF, Liu JJ, Pidoux I, Roughley PJ, Mort JS, Poole AR. Enhanced denaturation of the alpha (II) chains of type-II collagen in normal adult human intervertebral discs compared with femoral articular cartilage. J Orthop Res. 1996;14:61–66. doi: 10.1002/jor.1100140111. [DOI] [PubMed] [Google Scholar]
- 27.Harel A, Eliav U, Akselrod S, Navon G. Magnetization transfer based contrast for imaging denatured collagen. J Magn Reson Imaging. 2008;27:1155–1163. doi: 10.1002/jmri.21353. [DOI] [PubMed] [Google Scholar]
- 28.Comper WD. Extracellular matrix: tissue function. Amsterdam, The Netherland: Harwood Academic Publishers; 1996. [Google Scholar]
- 29.Inoue H. Three-dimensional architecture of lumbar intervertebral discs. Spine. 1981;6:139–146. doi: 10.1097/00007632-198103000-00006. [DOI] [PubMed] [Google Scholar]
- 30.Eyre DR, Wu JJ, Fernandes RJ, Pietka TA, Weis MA. Recent developments in cartilage research: matrix biology of the collagen II/IX/XI heterofibril network. Biochem Soc Trans. 2002;30(Part 6):893–899. doi: 10.1042/bst0300893. [DOI] [PubMed] [Google Scholar]
- 31.Fishbein KW, Gluzband YA, Kaku M, Ambia-Sobhan H, Shapses SA, Yamauchi M, Spencer RG. Effects of formalin fixation and collagen cross-linking on T2 and magnetization transfer in bovine nasal cartilage. Magn Reson Med. 2007;57:1000–1011. doi: 10.1002/mrm.21216. [DOI] [PubMed] [Google Scholar]
- 32.Grynpas MD, Eyre DR, Kirschner DA. Collagen type II differs from type I in native molecular packinG. Biochim Biophys Acta. 1980;626:346–355. doi: 10.1016/0005-2795(80)90129-4. [DOI] [PubMed] [Google Scholar]
- 33.Haefeli M, Kalberer F, Saegesser D, Nerlich AG, Boos N, Paesold G. The course of macroscopic degeneration in the human lumbar intervertebral disc. Spine. 2006;31:1522–1531. doi: 10.1097/01.brs.0000222032.52336.8e. [DOI] [PubMed] [Google Scholar]
- 34.Regatte RR, Akella SV, Borthakur A, Kneeland JB, Reddy R. Proteoglycan depletion-induced changes in transverse relaxation maps of cartilage: comparison of T2 And T1Rho. Acad Radiol. 2002;9:1388–1394. doi: 10.1016/s1076-6332(03)80666-9. [DOI] [PubMed] [Google Scholar]
- 35.Wheaton AJ, Dodge GR, Elliott DM, Nicoll SB, Reddy R. Quantification of cartilage biomechanical and biochemical properties via t1rho magnetic resonance imaging. Magn Reson Med. 2005;54:1087–1093. doi: 10.1002/mrm.20678. [DOI] [PubMed] [Google Scholar]
- 36.Li X, Benjamin MAC, Link TM, Castillo DD, Blumenkrantz G, Lozano J, Carballido-Gamio J, Ries M, Majumdar S. In vivo T(1RHO) and T(2) mapping of articular cartilage in osteoarthritis of the knee using 3 T MRI. Osteoarthr Cartil. 2007;15:789–797. doi: 10.1016/j.joca.2007.01.011. [DOI] [PMC free article] [PubMed] [Google Scholar]
- 37.Wang C, Auerbach JD, Witschey WR, Balderston RA, Reddy R, Borthakur A. Advances in magnetic resonance imaging for the assessment of degenerative disc disease of the lumbar spine. Semin Spine Surg. 2007;19:65–71. doi: 10.1053/j.semss.2007.04.009. [DOI] [PMC free article] [PubMed] [Google Scholar]
- 38.Watanabe A, Benneker LM, Boesch C, Watanabe T, Obata T, Anderson SE. Classification of intervertebral disk degeneration with axial T2 Mapping. AJR AM J Roentgenol. 2007;189:936–942. doi: 10.2214/AJR.07.2142. [DOI] [PubMed] [Google Scholar]
- 39.Kelsey JL, Githens PB, White AA, III, Holford TR, Walter SD, O’Connor T, Ostfeld AM, Weil U, Southwick WO, Calogero JA. An Epidemiologic study of lifting and twisting on the job and risk for acute prolapsed lumbar intervertebral disc. J Orthop Res. 1984;2:61–66. doi: 10.1002/jor.1100020110. [DOI] [PubMed] [Google Scholar]
- 40.Boos N, Weissbach S, Rohrbach H, Weiler C, Spratt KF, Nerlich AG. Classification of age-related changes in lumbar intervertebral discs: 2002 volvo award in basic science. Spine. 2002;27:2631–2644. doi: 10.1097/00007632-200212010-00002. [DOI] [PubMed] [Google Scholar]


