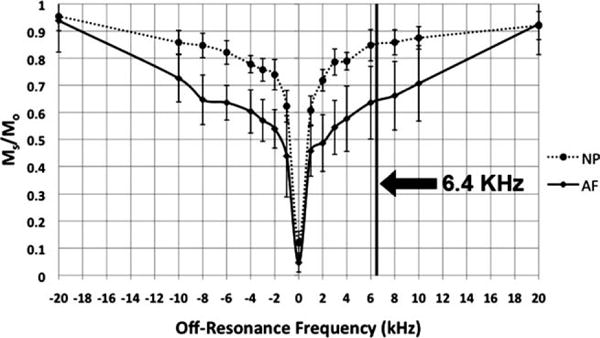
FIG. 5.

The z-spectra of a subject’s L4/L5 IVD’s AF and NP compartments. The y-axis is the saturation ratio and the x-axis represents the off-resonance frequency of the saturation transfer pulse. The standard deviations of the MTR ROI measurements were graphed as the errors. The vertical line indicates the off-resonance frequency (6.4 kHz) used for all subsequent in vivo MTR map acquisition.
