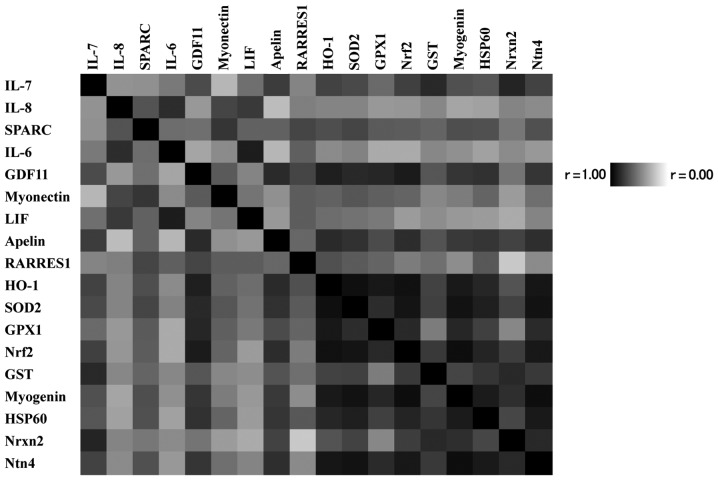
Figure 1.
Correlation matrix among the gene expressions altered by dietary level of vitamin B6. The dark colour scheme corresponds to correlation strength as shown by the deep colour bar. IL, interleukin; SPARC, secreted protein acidic and rich in cysteine; GDF, growth differentiation factor; LIF, leukemia inhibitory factor; RARRES1, retinoic acid receptor responder (tazarotene induced) 1; HO, heme oxygenase; SOD, superoxide dismutase; GPX, glutathione peroxidase; Nrf, nuclear respiratory factor; GST, glutathione S-transferase; HSP, heat shock protein; Nrxn, neurexin; Ntn, netrin.

