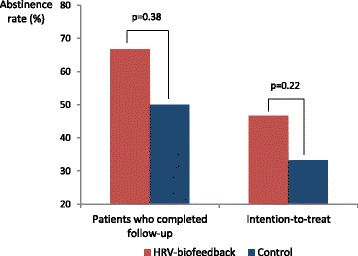
Fig. 1.

Abstinence rate one year after discharge from the rehabilitative therapy. The bar graph shows the rates of one-year abstinence in each study arm (HRV-biofeedback and control). Results are separately displayed for patients who completed follow-up and the entire population (intention-to-treat). A non-significant trend toward increased abstinence one year post-HRV-biofeedback (red bars) compared with control patients who have not undergone the intervention (blue bars) was observed when only complete cases were included. This was also true in the intention-to-treat analysis where patients who have not completed follow-up were considered to have relapsed was performed
