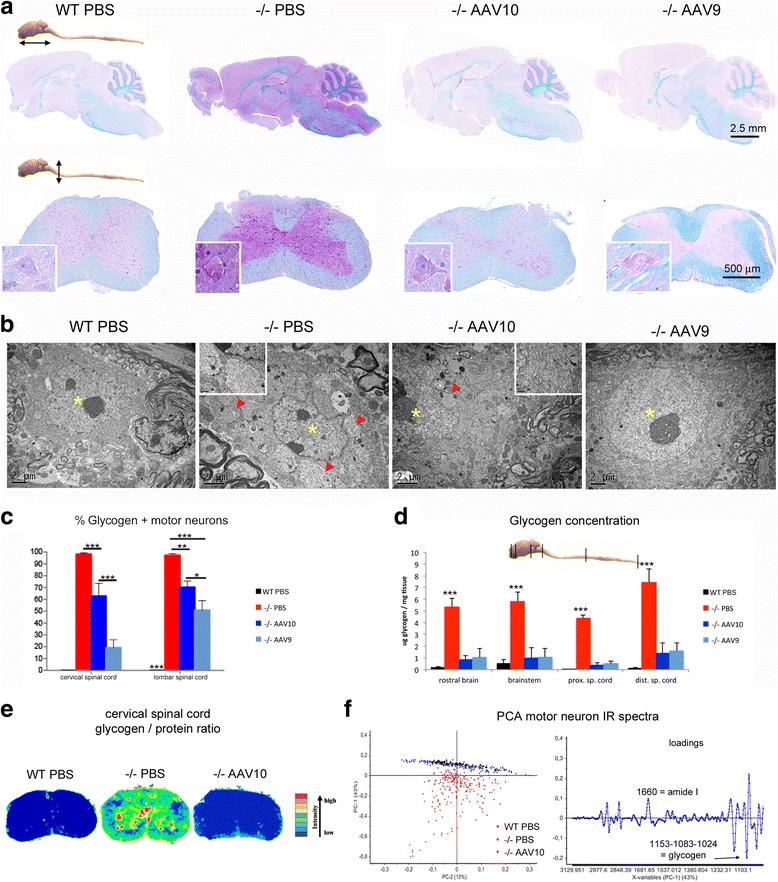
Fig. 3.

Central nervous system is normalized at 12 months. Treatment groups were as described in Fig. 1. a Representative sections of brain and cervical spinal cord, paraffin embedding, PAS-luxol fast blue stain. The glycogen storage appears purple on a blue background, insets show motor neuron of spinal cord ventral horn. b Representative ultrastructure of cervical spinal cord motor neurons, epon embedding, uranyl acetate contrast. The nuclei are indicated with yellow asterisks and the glycogenosomes with red arrowheads. c Quantification of the PAS positive ie glycogen-filled motor neurons in PAS stained paraffin-embedded sections from the cervical and lumbar spinal cord (one-way ANOVA with Newman-Keuls post hoc test; n = 4 animals in each group, 6 sections per animal: **P < 0.01; ***P < 0.001). d Glycogen concentration measurement in CNS tissue extracts obtained from samples that were snap-frozen in liquid nitrogen rapidly after sacrifice (one-way ANOVA with Newman-Keuls post hoc test; n = 4 to 5 per group: **P < 0.01; ***P < 0.001) ***P < 0.001). MNs were considered glycogen positives when the PAS staining intensity MN analysed was superior to PAS staining intensity of wt MNs. (e) Infrared chemical mapping performed on dewaxed formalin fixed paraffin embedded spinal cord sections. Chemical imaging was performed after the infrared chemical mapping showing the relative concentration of glycogen. Concentrations were determined by the area under the curve for the glycogen pic centered at 1080 cm-1 normalized versus the protein pic area centered at 1654 cm-1. f Principal component analysis (PCA) of the IR spectra collected by mapping motor neurons in FTIR microspectroscopy using a synchrotron light source and the corresponding loading plot (n = 156, 239, and 164 spectra for WT, −/− PBS, and −/− AAV10 respectively)
