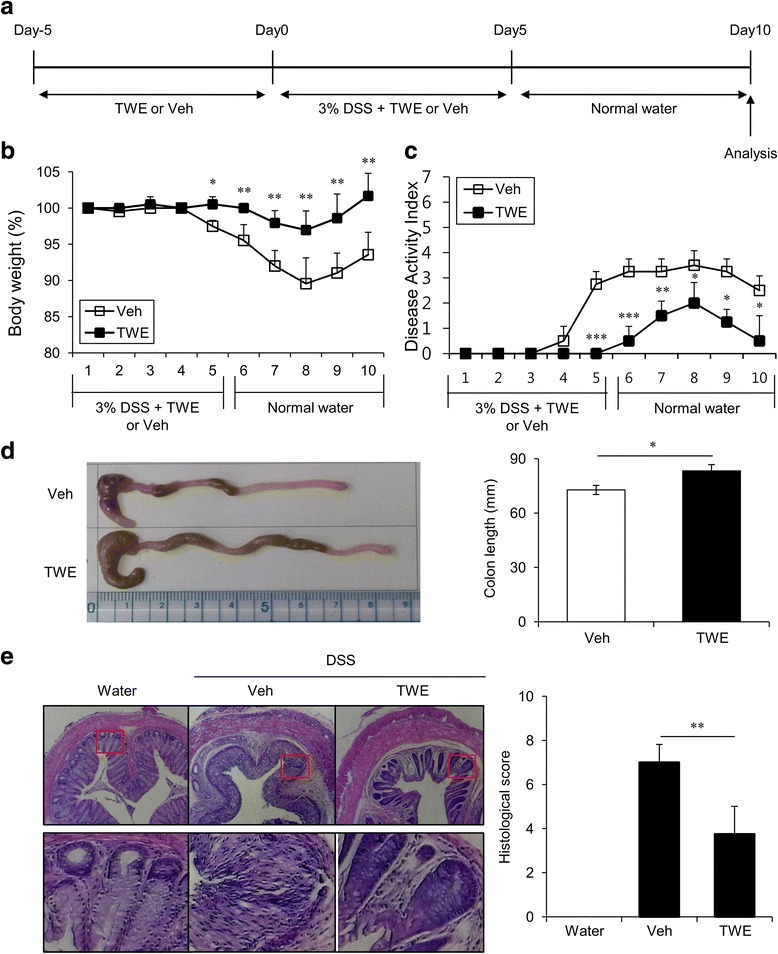
Fig. 4.

TWE protects mice from DSS-induced colitis. a Experimental scheme for TWE treatment in the DSS-induced colitis model. b Body weight change, shown as a percentage change relative to the body weight at day 0, was measured daily after DSS-induced colitis with or without TWE treatment. The mean values ± SD (n = 5, * P < 0.05, ** P < 0.01, *** P < 0.001) are shown. c Weight loss, stool consistency, and fecal blood were scored to provide the DAI for each group. d On day 10, the colons were removed, and their lengths were measured. The photos of representative colons are shown. The mean values ± SD (n = 5, * P < 0.05) are shown. e Histological examination of the colon tissue was performed at day 10 (left panel). The histological score was measured for colon cellular infiltration and tissue disruption (right panel). Representative colon tissue sections are shown. The mean values ± SD (n = 5, ** P < 0.01) are shown
