Fig. 4.

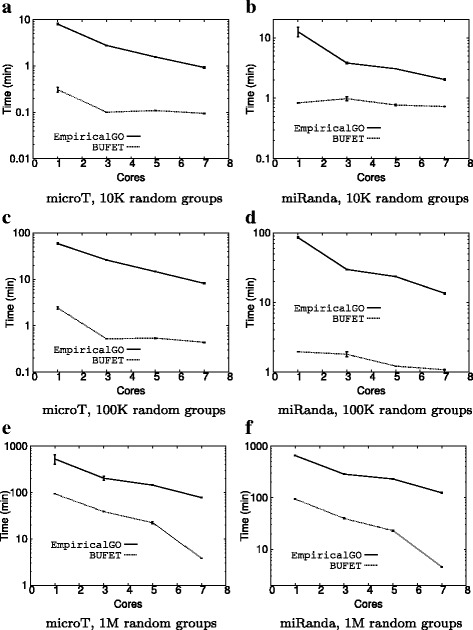
Average execution times (log scale) varying the number of cores. a microT, 10K random groups. b miRanda, 10K random groups. c microT, 100K random groups. d miRanda, 100K random groups. e microT, 1M random groups. f miRanda, 1M random groups

Average execution times (log scale) varying the number of cores. a microT, 10K random groups. b miRanda, 10K random groups. c microT, 100K random groups. d miRanda, 100K random groups. e microT, 1M random groups. f miRanda, 1M random groups