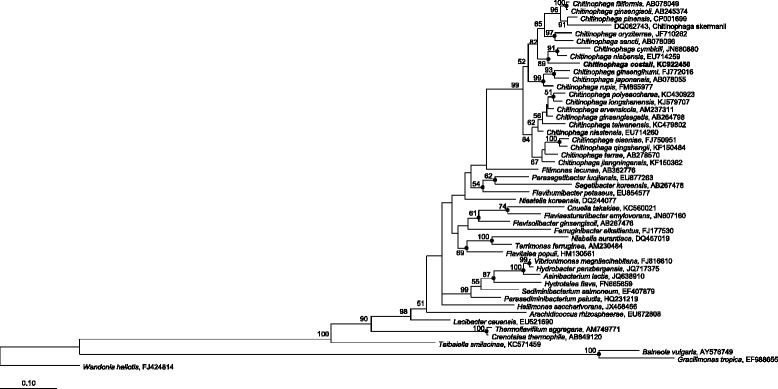
Fig. 2.

Phylogenetic tree based on a comparison of the 16S rRNA gene sequence of strain A37T2T and the other type strains within the family Chitinophagaceae. The tree was created using the maximum likelihood method (RAxML). The numbers on the tree indicate the percentages of bootstrap sampling, derived from 1000 replications; values below 50% are not shown. Symbol (•) indicates node branches conserved when the tree was reconstructed using the neighbor-joining method. The isolate characterized in this study is indicated in bold. Scale bar, 1 inferred nucleotide substitution per 100 nucleotides
