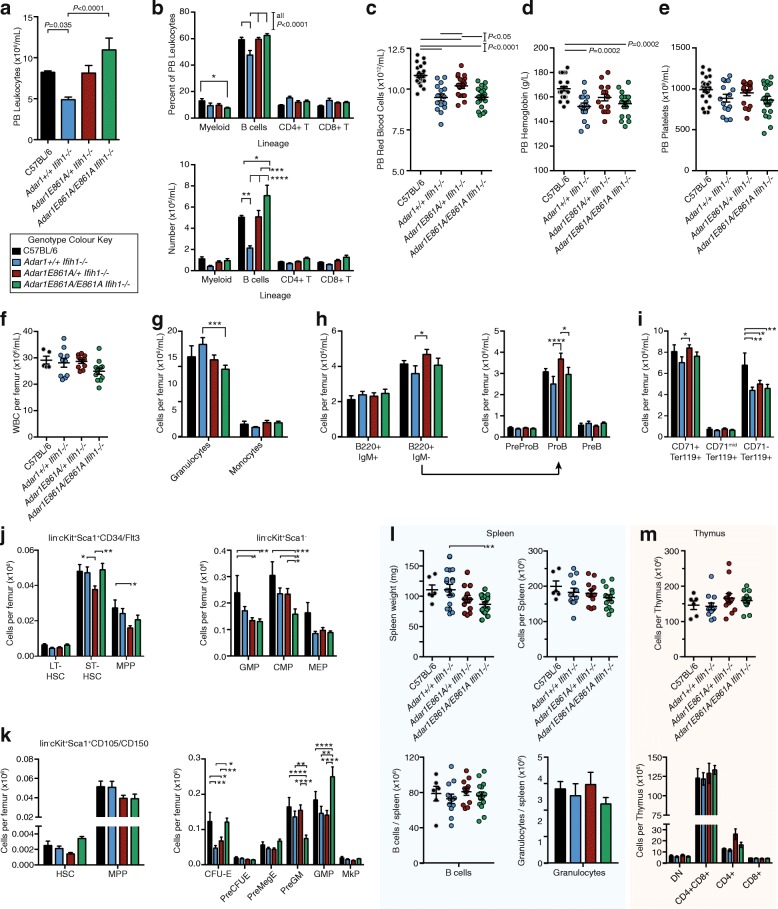
Fig. 3.
Hematopoiesis and B-cell production are normal in the absence of ADAR1 editing. PB, BM, spleen, and thymus analyzed of 12-week-old mice. a–e PB analysis from C57BL/6 (n = 25), Adar1 +/+ Ifih1 -/- (n = 15), Adar1 E861A/+ Ifih1 -/- (n = 17), Adar1 E861A/E861A Ifih1 -/- (n = 19) indicating (a) total leukocyte counts, (b) % and absolute number of each leukocyte subtype, (c) red blood cell counts, (d) hemoglobin levels, and (e) platelet numbers. f–j BM analysis of C57BL/6 (n = 5), Adar1 +/+ Ifih1 -/- (n = 10), Adar1 E861A/+ Ifih1 -/- (n = 11), Adar1 E861A/E861A Ifih1 -/- (n = 11) showing (f) total leukocyte counts per femur, (g) numbers of granulocytes and monocytes, (h) mature (B220 + IgM+) and immature (B220 + IgM-) B-cell populations and subsets of the immature populations as indicated, (i) erythroid cells; and j–k hematopoietic stem and progenitor populations using two methods. (l) Spleen weight and cellularity, B cells and granulocyte numbers per spleen from C57BL/6 (n = 6), Adar1 +/+ Ifih1 -/- (n = 12), Adar1 E861A/+ Ifih1 -/- (n = 12), Adar1 E861A/E861A Ifih1 -/- (n = 14). (m) Thymic cellularity and CD4/CD8 composition in C57BL/6 (n = 6), Adar1 +/+ Ifih1 -/- (n = 12), Adar1 E861A/+ Ifih1 -/- (n = 12), Adar1 E861A/E861A Ifih1 -/- (n = 13). Results are mean ± SEM; data shown are pooled from at least three independent experiments; significance determined using two-way ANOVA with correction for multiple comparisons; *P < 0.05, **P < 0.01, ***P < 0.001, ****P < 0.0001

