Fig. 6.
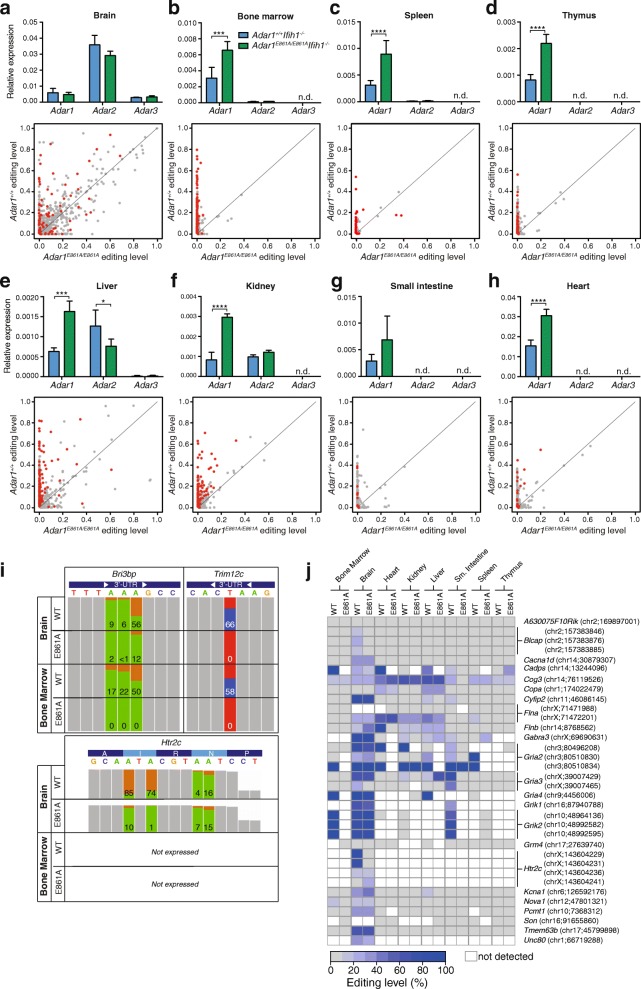
ADAR1 is the predominant ADAR in peripheral tissues and affects editing levels across all tissues. a–h Upper panels: qRT-PCR of Adar expression from tissues of 12-week-old mice. Data normalized to Ppia and are the mean ± SEM (n = 3/genotype). n.d not detected. Lower panels: Editing of known sites measured using multiplexed PCR and deep sequencing (mmPCR-seq) in each tissue. Editing levels in Adar1 +/+ Ifih1 -/- (ADAR1 WT; y-axis) plotted against those in the Adar1 E861A/E861A Ifih1 -/- (ADAR1 editing deficient; x-axis) with each individual site indicated by a dot. Gray dot = no significant difference, red dot = P < 0.05. i Examples of editing at three loci. Colored panels indicate the edited nucleotides ((+) strand: green = A, orange = G; (-) strand: red = T(A), blue = C(G)). Bri3bp is a representative shared Adar1 and Adar2 target at the third adenosine; Trim12c is representative of an ADAR1-specific target. Htr2c is representative of an ADAR1-specific recoding event at the first two sites. Percent editing is indicated for each site. j Analysis of conserved editing sites in each tissue by mmPCR-seq. Editing sites were compared between Adar1 +/+ Ifih1 -/- (ADAR1 WT) and Adar1 E861A/E861A Ifih1 -/- tissues as indicated. White indicates no expression/reads detected in the tissue. Data include all sites with > 100 reads in the mmPCR-seq

