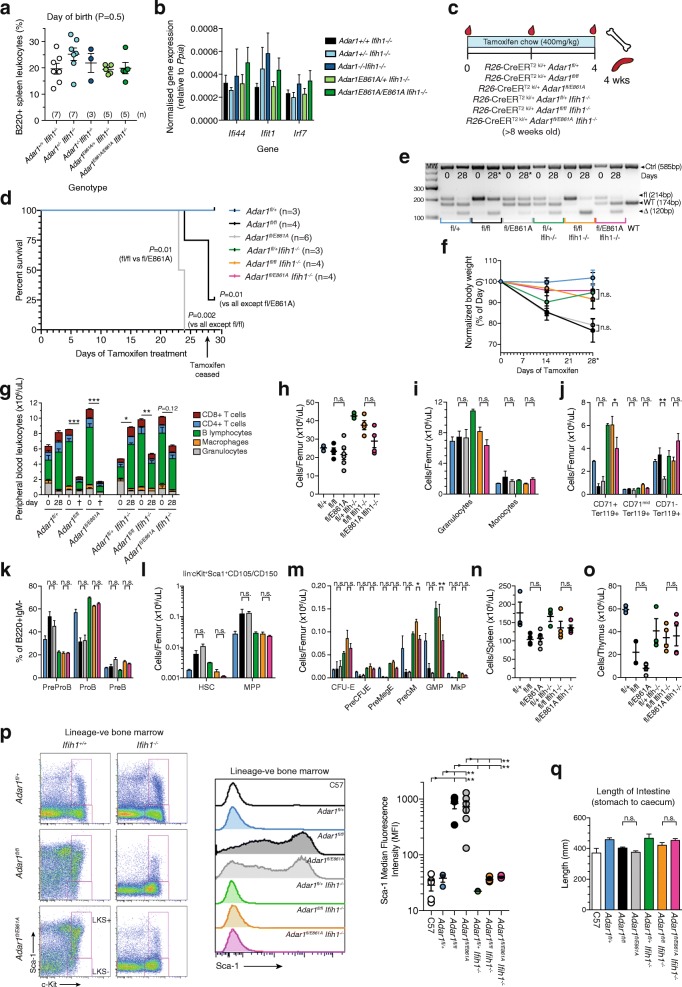
Fig. 7.
The complete absence of ADAR1 and the specific loss of ADAR1-mediated editing activity phenocopy. a Percentage of B cells (B220 + ve) spleen leukocytes in the indicated genotypes at the day of birth, n as indicated in (a). Data are pooled from at least two separate litters per genotype. b Expression of Ifi44, Ifit1, and Irf7 transcript in whole brain from the indicated genotypes on the day of birth, n as for (a). c Experimental outline of somatic deletion model; all mice were aged ≥ 8 weeks at tamoxifen initiation (defined as day 0). d Kaplan–Meier survival plot of each genotype. All Ifih1 -/- lines fall under the Adar1 fl/+. Mice were analyzed on the day of euthanasia or day 29 as indicated. e Genotyping of genomic DNA at day 0 (PB-derived cells) and day 28/euthanasia (BM-derived cells) for each genotype. f Change in body weight (day 0 normalized to 100%) and day 28/euthanasia. g PB leukocyte counts and lineage distribution within the total leukocyte count at day 0 (pre-tamoxifen) and day of euthanasia or day 28 as indicated in (b). Statistics compare day 0 and day of euthanasia/day 28 within an individual genotype. h BM cellularity, (i) granulocytes and macrophages, (j) erythroid cells, (k) percentages of B cell precursors within the B220 + IgM- population, (l) stem cell and multipotent progenitor populations, (m) the numbers of myelo-erythroid progenitors/femur for each genotype. n Spleen and (o) thymus cellularity. p Representative FACS plots of Sca-1 expression in the lin-c-Kit+ BM fraction. Representative median fluorescence intensity histogram plots of Sca1 and quantitation of Sca1 expression levels. q Intestine length (stomach – caecum) for each genotype at day of euthanasia or day 29 as indicated in (b). Statistical comparison (except (b, d)) shown only for R26-CreERki/+ Adar1 fl/fl vs. R26-CreERki/+ Adar1 fl/E861A and R26-CreERki/+ Adar1 fl/fl Ifih1 -/- vs. R26-CreERki/+ Adar1 fl/E861A Ifih1 -/-. Full statistical analysis of all comparisons in Additional file 6: Table S1. Number of animals per group indicated in (b); data are pooled from two separate experiments. *P < 0.05; **P < 0.01, ***P < 0.001

