Fig. 2.—
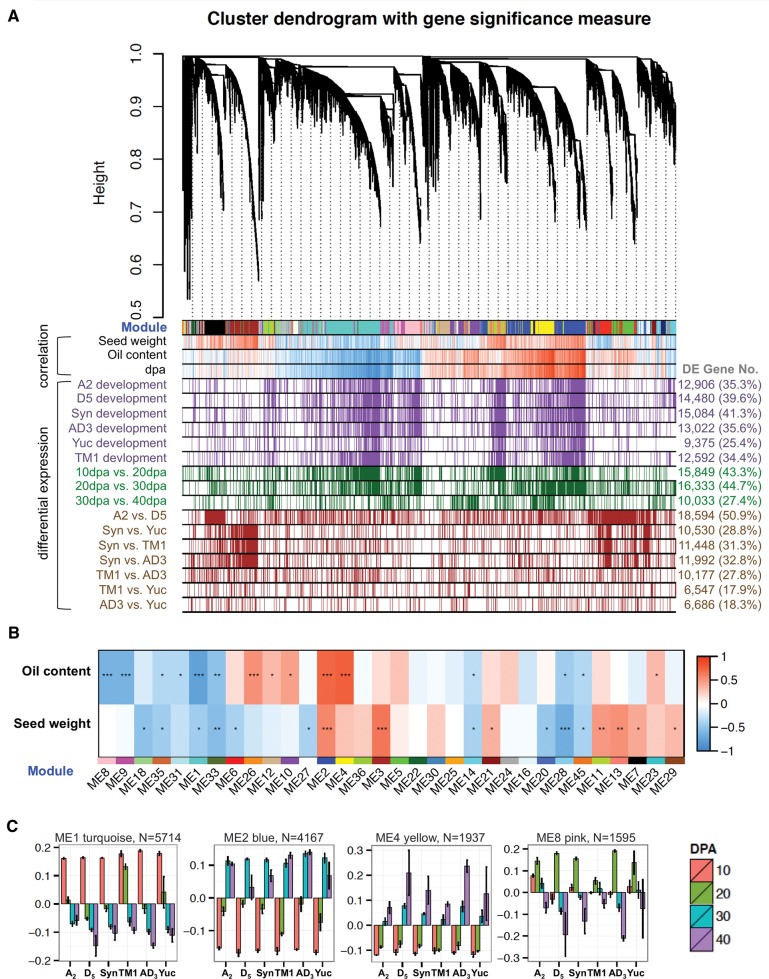
Multi-species co-expression network analysis. (A) Hierarchical cluster tree showing co-expression modules identified using WGCNA. Modules correspond to branches and are labeled by colors as indicated by the first color band underneath the tree. In the “correlation” bars, red and blue color bands indicate genes displaying expression that is highly correlated (red) or anti-correlated (blue) with phenotypic traits (seed weight, percentage oil content) or developmental stage (dpa). In the “differential expression” bars, purple, green, and brown color bands present genes differentially expressed between sampling conditions. Purple = genes differentially expressed between any two adjacent stages for that species; green = genes differentially expressed for all six accessions for the dpa comparison shown; brown = genes differentially expressed between species/accession for any stage. (B) Correlation between co-expressed modules and seed traits. For 32 modules showing significant relationships with developmental and interspecific changes (Anova P < 0.05), module eigengenes (columns labeled by module ID and assigned color) were correlating to trait measurements of oil content and seed weight (rows). Heatmap colors correspond to correlation coefficients and stars to BH corrected P-values (*q < 0.05; **q < 0.001; ***q < 0.0001). (C) Eigengene expression for modules associated with oil content. Bar plots present eigengene values centered by mean across genomes and developmental stages. Error bars represent the standard errors among three biological replicates for each genome at each developmental stage. Module color and number of module member genes are noted above each bar graph.

