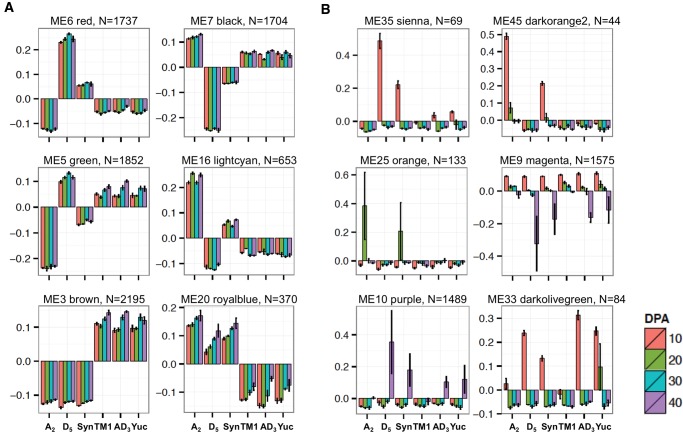
Fig. 4.—
Eigengene expression for modules displaying expression-level dominance and transgression. These co-expression patterns could be consistent between developmental stages (A) or be specific to certain stages and variable between allopolyploid species (B). Bar plots present eigengene values centered by mean across genomes and developmental stages. Error bars represent the standard errors among three biological replicates for each genome at each developmental stage. Module color and number of module member genes are noted above each bar graph.

