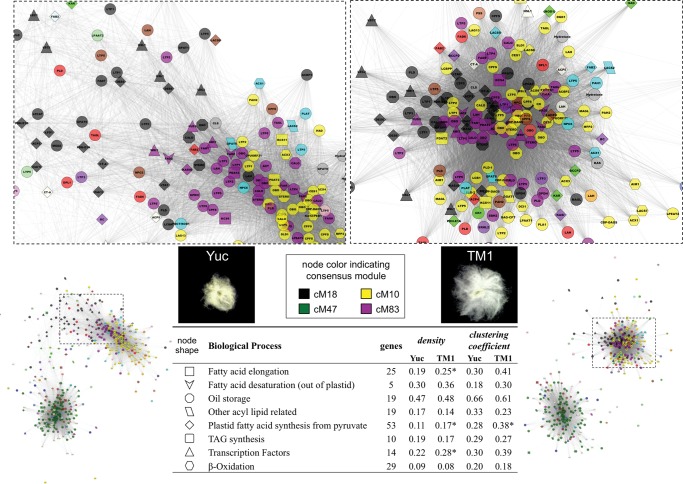
Fig. 7.—
Visualization of the oil related gene co-expression network in wild (Yuc; left panels) and domesticated (TM1; right panels) G. hirsutum developing seeds. The network overview (bottom panels) and a closer view (upper panels) of the “up-regulated” cluster are shown for each genome. The bottom table summarizes the sub-network properties of density and clustering coefficient at the gene family level. A bootstrap approach was used to test differences between TM1 and Yuc parameters, and * denotes high values with significance (P < 0.05). TAG, triacylglycerol.

