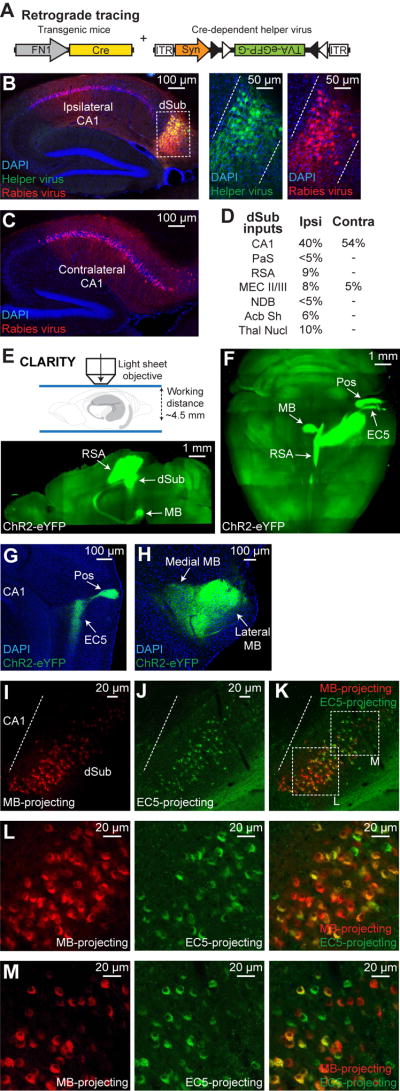
Figure 2. Input-output organization of dSub excitatory neurons.
(A) Monosynaptic retrograde tracing of dSub inputs used a Cre-dependent helper virus (tagged with eGFP) combined with a rabies virus (RV, mCherry) injected into dSub of FN1-Cre mice. Avian leukosis and sarcoma virus subgroup A receptor (TVA) and rabies glycoprotein (G).
(B, C) Representative ipsilateral sections confirmed efficient overlap of helper and RV-infected dSub neurons. Sagittal image (left; B), higher magnification images of boxed region (right; B). Quantification revealed that 78% of dSub cells, relative to DAPI+ neurons, were RV-positive (n = 4 mice), which is the starting population for retrograde tracing. Dashed white lines denote dSub Cre+ neuron target region. Both ipsilateral and contralateral sagittal sections revealed that dorsal CA1 provides the major input to dSub Cre+ neurons (C).
(D) Inputs to dSub Cre+ neurons were quantified based on percentage of neurons in the target brain region relative to DAPI+ neurons (n = 4 mice). Ipsilateral (Ipsi) and contralateral (Contra) counts. Parasubiculum (PaS), retrosplenial agranular cortex (RSA), MEC layers II/III (MEC II/III), nucleus of the diagonal band (NDB), nucleus accumbens shell (Acb Sh), and thalamic nuclei (Thal Nucl).
(E) FN1-Cre mice expressing ChR2-eYFP (Cre-dependent virus) in dSub neurons were used for CLARITY followed by light sheet microscopy (top). 2.5 mm optical section in sagittal view shows projections to RSA and mammillary bodies (MB, bottom).
(F) Whole-brain, stitched z-stack (horizontal view) shows all major projections from dSub Cre+ neurons including RSA, MB, EC5, and postrhinal cortex (Pos).
(G, H) Standard sagittal brain sections of FN1-Cre mice expressing ChR2-eYFP (Cre-dependent virus) in dSub neurons showing dSub projections to EC5 and Pos (G), as well as medial and lateral MB (H).
(I–M) Representative standard sagittal brain sections showing dSub neuronal populations projecting to MB (red, CTB555; I) or EC5 (green, CTB488; J). The respective CTB was injected into MB or EC5. Overlap image (K). Quantification, including weakly labeled CTB+ neurons, revealed that 81% of dSub cells were double positive (n = 4 mice). Scale bar in panels I–J applies to panel K. Dashed white line denotes CA1/dSub border. Higher magnification images of boxed regions indicated in Figure 2K (L–M).

