
Fig. 5.
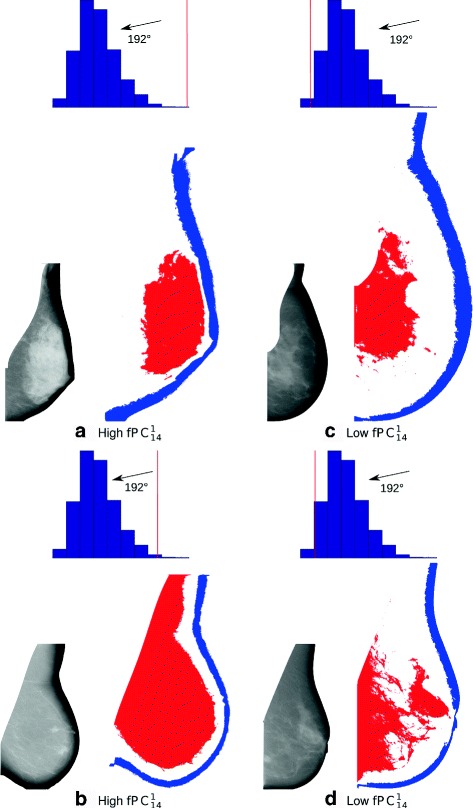
Examples of mammograms with high ((a) and (b)) and low ((c) and (d)) values of . Original mammograms are shown next to their segmented regions 1 (dark blue) and 4 (red). The histograms of FH 14 at an angle of 192° are included above each image with the value for the specific image marked as a vertical red line. A low value, after adjustment for PD and other covariates, is associated with increased risk of breast cancer. PD percentage density