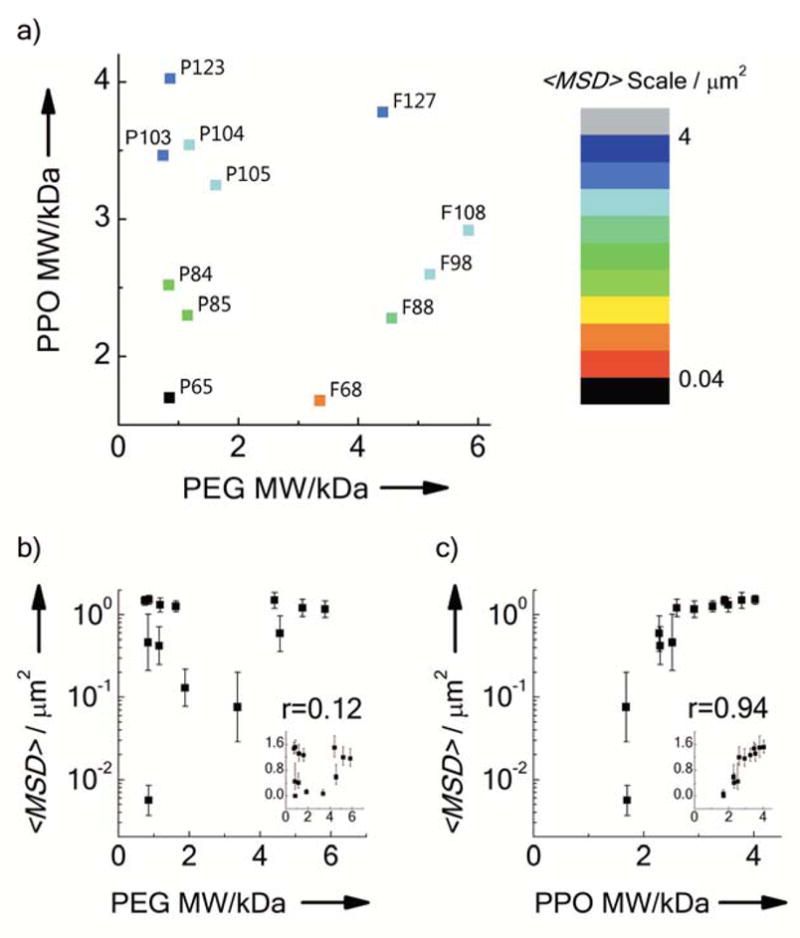
Figure 3.

Mobility of CUR NS formulated with different Pluronics coatings in human CVM. a) Phase diagram correlating <MSD> at a time scale of 1s of CUR NS to the MW of the Pluronics PEG segments and the poly(propylene oxide) (PPO) segment. Each data point represents a specific type of Pluronic, as indicated. b–c) <MSD> at a time scale of 1 s as a function of the MW of b) PEG or c) PPO segments. The insets represent the same plot with linear scale of <MSD>, while r represents the correlation coefficient. Data represent the ensemble average of at least three independent experiments, with n ≥ 100 particles tracked for each experiment. Error bars indicate geometric standard error.
