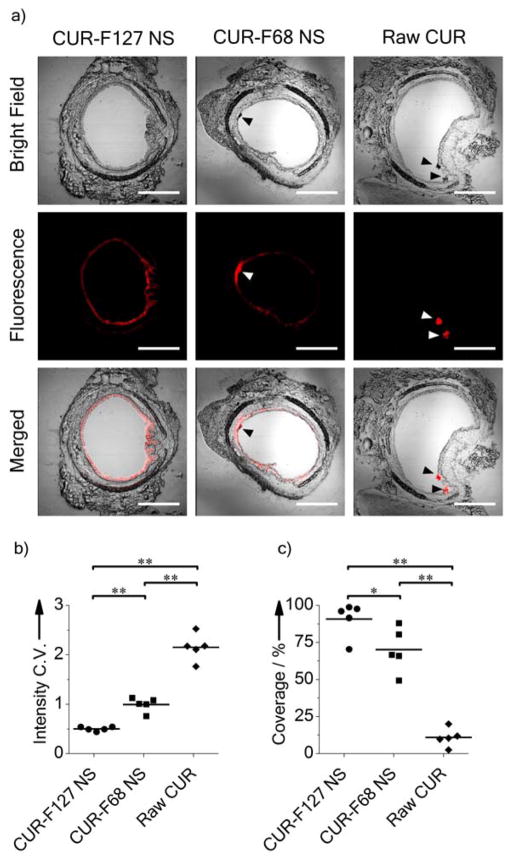
Figure 4.
Distribution of CUR-F127 NS, CUR-F68 NS and Raw CUR in mouse airways. a) Transverse frozen sections of mouse trachea tissue following intranasal administration of NS or raw drug suspension. Red represents CUR fluorescence. Arrows indicate drug aggregates. Scale bars represent 500 μm. b) Coefficient of variations (C.V.) of fluorescence intensity profiles along the airway epithelial surface. Lower C.V. represents better uniformity of distribution. c) Percent coverage of CUR along the airway epithelial surface. (*, p < 0.05; **, p < 0.01; n = 5 mice for each group.)

