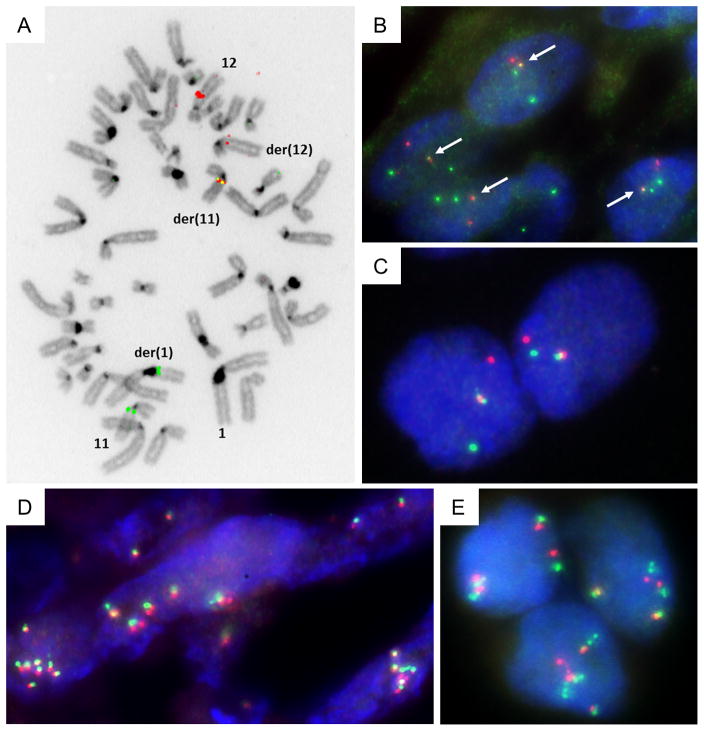
Figure 3.
Metaphase dual-color FISH on index case 1 using SG-labeled RP11-472D15 and SO-labeled RP11-181L23 BAC probes that cover respectively the MALAT1 and GLI1 genes, indicate the presence of the MALAT1-GLI1 fusion (A). Interphase dual-color FISH on FFPE tissue from case 1 using SG-labeled RP11-472D15 and SO-labeled RP11-181L23 BAC probes that cover the MALAT1 and GLI1 genes, respectively. Overlapping green and red signals indicate MALAT1-GLI1 fusion (B). Interphase dual-color FISH on case 14 using SG-labeled RP11-1077C21 (centromeric) and SO-labeled RP11-571M06 (telomeric) BAC probes that flank the GLI1 gene. Rearrangement of GLI1 is pointed out by split apart green and red signals (C). Interphase dual-color FISH using probes that flank GLI1 on FFPE tissue from cases 4 and 15, showing polysomy of GLI1 (D and E).

