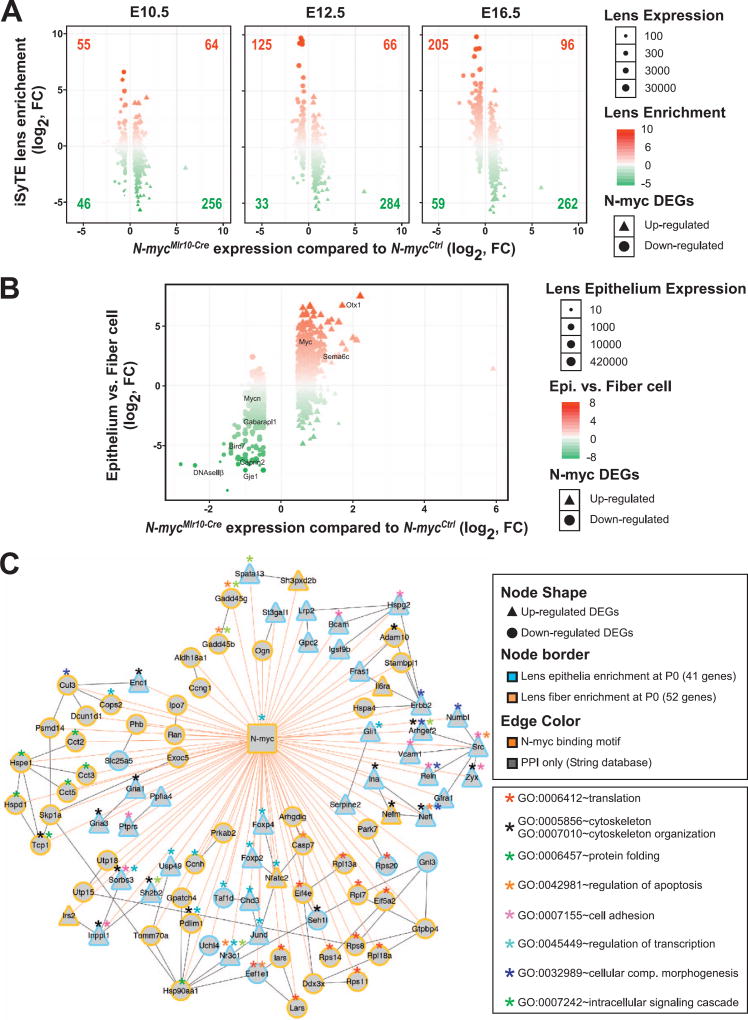
Fig. 5. Transcriptome of N-myc-deficient lens reveals changes in gene expression in epithelial and fiber cells.
(A) The iSyTE lens-enrichment score (y-axis) for down- and up-regulated N-myc-deficient lens DEGs (x-axis) was computed by comparing lens expression with the whole embryo body (WB) reference control at embryonic stages E10.5, E12.5 and E16.5. Circles represent down-regulated and triangles represent upregulated DEGs in N-myc-deficient. Lens-enrichment scores are indicated by colors: Red represents lens-enriched genes and green represents genes expressed at higher levels in the WB reference. Lens expression levels in iSyTE are indicated by the size of circles and triangles. As the lens progresses from E10.5 to E12.5, majority of down- and up-regulated DEGs fall into the lens-enriched (upper left and right quadrant). The difference between lens enriched DEGs compared to lens non-enriched DEGs was significant for E12.5 and E16.5. A χ2 test for goodness of fit (p < 0.00001) and a two-tailed t-test were performed. (B) N-myc-deficient lens DEGs (x-axis) were plotted against previously identified epithelial- or fiber-enriched genes in P0 mouse lens (y-axis; fiber enrichment is negative). (C) A N-myc-regulatory network was assembled based in the integration of multiple data (presence of N-myc binding motifs in DEGs, known protein-protein interactions between DEGs, overlay of information on enriched GO categories). N-myc-deficient lens DEGs (57 down-regulated circles and 33 up-regulated triangles) identifed with putative N-myc binding motifs in their 2500 bp upstream of TSS (edge color = orange) were subjected to String database analysis to compute evidence from molecular interaction with edge score > 400 (edge color = grey). DEGs were also analyzed for enrichment in isolated lens epithelium (Epi) and fiber cell (FC) at P0 (blue node border represents Epi-enriched and yellow node border represents FC-enriched). Asterisk indicates enriched GO categories identified in the network.

