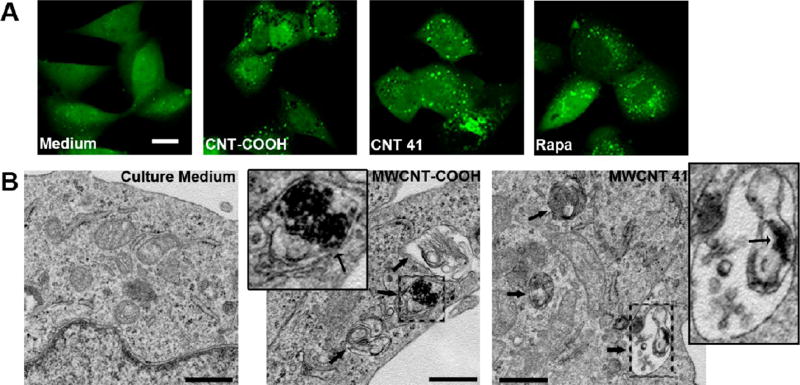
Figure 5.
MWCNT-COOH and MWCNT 41 induce cell autophagy. (A) Induced cell autophagy is assayed by immunofluorescence in U87 reporter cells. Representative images of MWCNT 100 µg/mL were shown. Medium and rapamycin (Rapa, treated for 4 h at 4 µM) were respectively used as negative and positive controls. The scale bar (top left) is for 20 µm. (B) Transmission electron microscope images show autophagosomes formation in treated HEK 293 cells; the inset images are the enlargement of a single autophagosome (broad black arrow indicates an autophagosome; narrow black arrow in the inset indicates MWCNTs in autophagosomes). The scale bar represents 500 nm.

