
Figure 3. Lipid signals downregulate Akt3 kinase activity selectively.
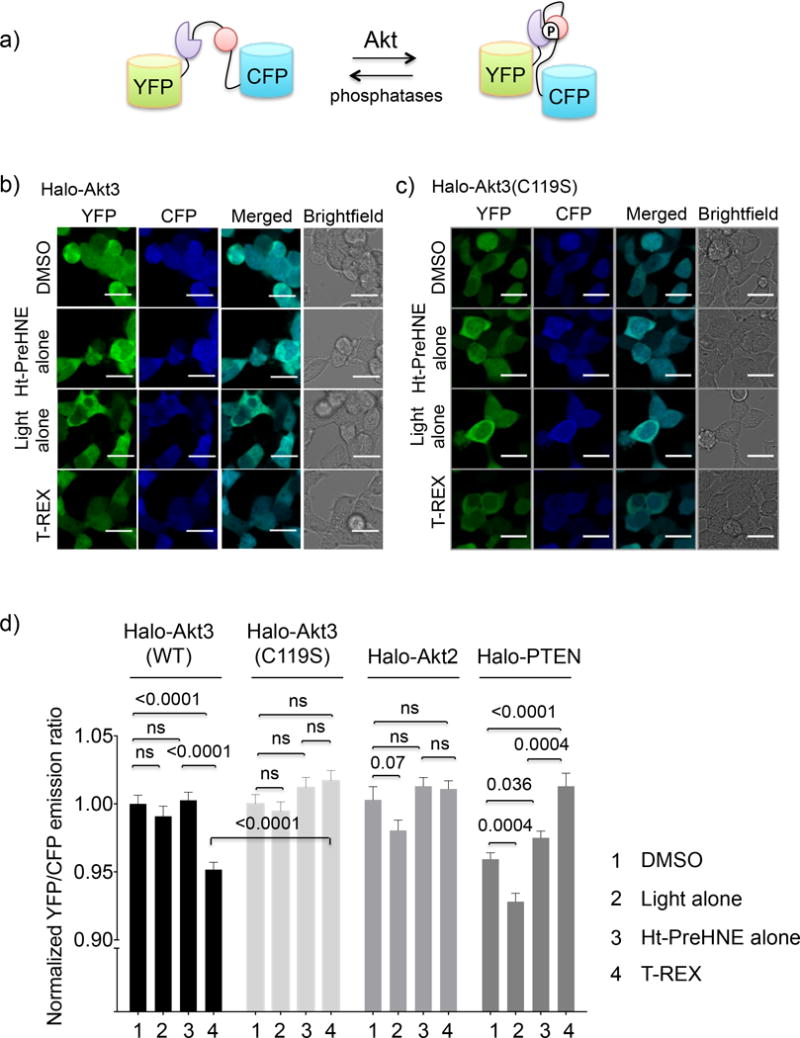
(a) Schematic of the FRET-based Akt activity reporter (AktAR)24. Phosphorylation of a peptide substrate (pink) by Akt isozymes allows a phospho-peptide binding domain (purple) to bind the phosphorylated substrate resulting in an increase in FRET. (b–c and Supplementary Fig. 4) HEK 293T cells co-transfected with AktAR reporter plasmid24 and mRNA encoding either Halo-Akt3 (these data are consistent with a blinded study) (b), Halo-Akt3(C119S) (c), were subjected to T-REX-assisted HNE-targeting. After 8–10 h, cells were excited using an Argon laser (458 nm). Images were obtained using cyan (463–498 nm) and yellow (525–620 nm) channels. Scale bar: 20 μm (f) Quantitation of YFP/CFP ratio of individual cells in b–c and Supplementary Fig. 4 using Image-J. Error bars designate s.e.m. with n = Akt3(wt) (197, 124, 205, 185); Akt3(C119S) (242, 243, 252, 240); Akt2 (107, 103, 103, 104); and PTEN (94, 38, 52, 43) for DMSO, light alone, Ht-PreHNE alone, and T-REX, respectively, where n designates number of cells quantitated per condition from two independently replicated sets at different passage numbers. Also see Supplementary Fig. 4–8.