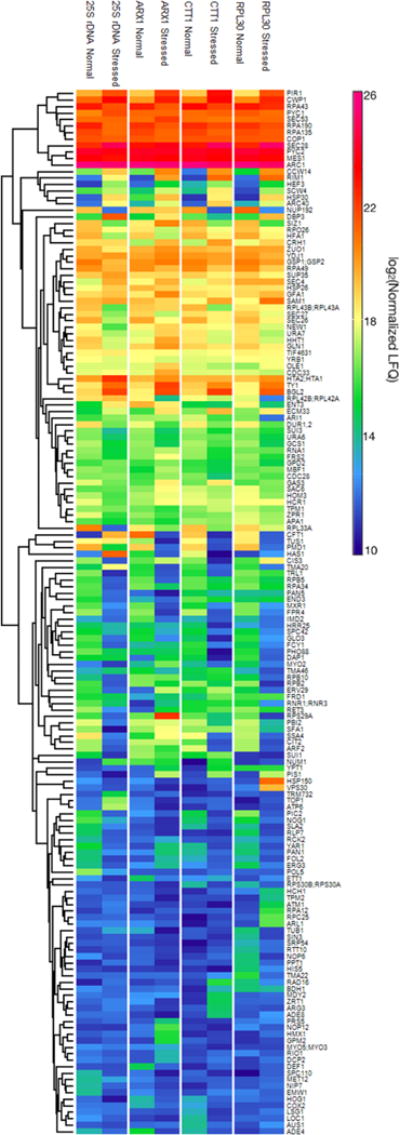
Figure 2.

Heat map of enriched proteins. As described in the main text, 161 proteins were identified as enriched at one or more of the four loci. The corresponding protein abundance levels are shown here for each of the four loci and two conditions (normal vs stressed) investigated. Details of the heat map generation are provided in the Supporting Information, along with an alternative arrangement of the figure (SI Figure S-5) to facilitate comparison of results from the different loci.
