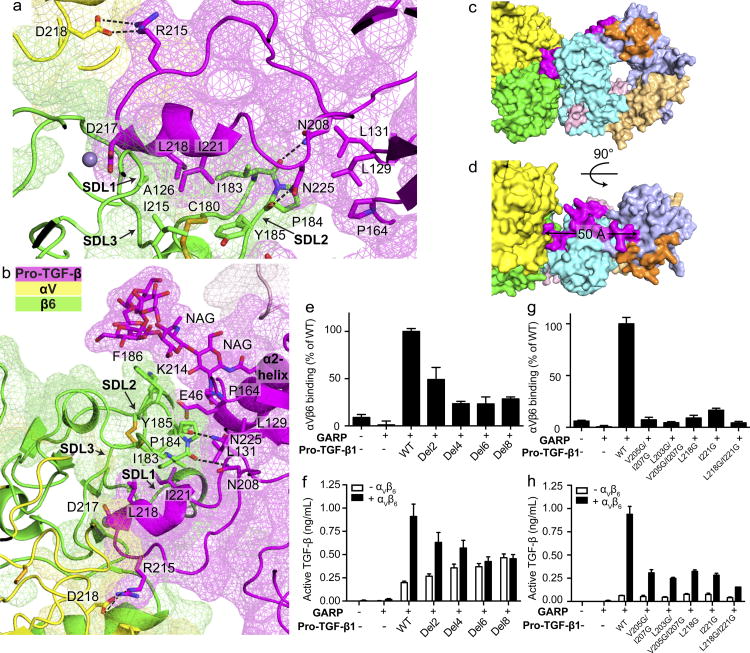
Figure 3. Interaction between TGF-β1 and αVβ6.
(a–b) Slab views through the αVβ6:TGF-β1 interface showing surfaces of αV, β6, and TGF-β1 (mesh), ribbon cartoons, key N-glycan and protein sidechains (sticks), hydrogen bonds (black dashes) and MIDAS metal ion (sphere). (c–d) Surface representations of the 1:2 complex, color coded as in Fig. 1a. (e–h) Binding and activation of WT and mutant pro-TGF-β1 by αVβ6. (e and g) Binding of FITC-αVβ6 to pro-TGF-β1/GARP HEK293T co-transfectants as mean fluorescence intensity. (f and h) Activation of TGF-β1 by HEK293T cells co-transfected with pro-TGF-β1 and GARP, with or without αV and β6. Data in e–h are mean ±s.d. of 3 biological (transfection) replicates.

