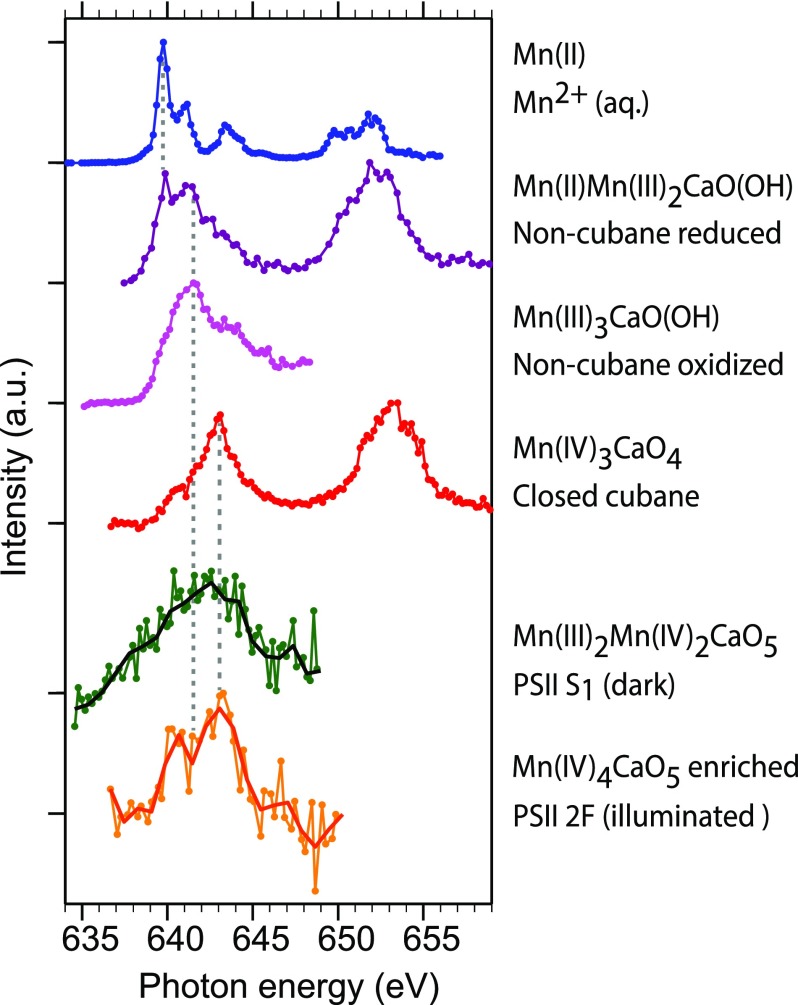
FIG. 4.
Mn L3,2-edge partial-fluorescence yield x-ray absorption spectra of PS II and inorganic high-spin model complexes as measured in solution (see Fig. 1 for molecular structures). Top to bottom: 500 mM Mn2+aq solution [the Mn2+aq spectrum is the same as in Fig. 2(b)], three inorganic Mn3CaOx model complexes with Mn concentrations of 6–15 mM (structures are given in Fig. 1), and the Mn4CaO5 cluster in PS II with a Mn concentration of 0.8 mM measured for the S1 dark resting state (green circles, black line) and an illuminated PS II sample (2 F, meaning that it was illuminated with two optical flashes) in an S3-enriched state (orange circles, red line). The solid lines for the PS II measurements are the original data binned to energy regions of 0.8 eV.

