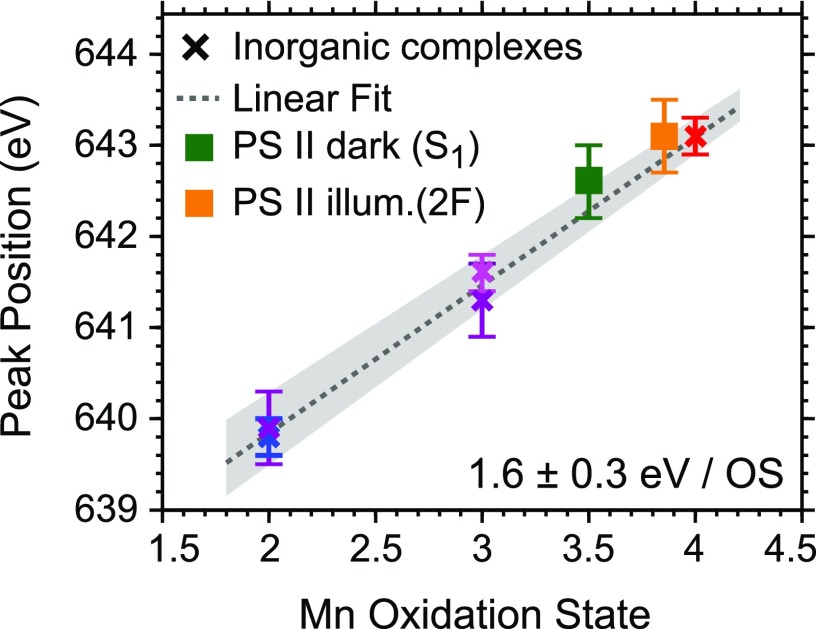
FIG. 5.
Mn L3-edge peak-maximum positions of the spectra shown in Fig. 4 versus formal oxidation states of Mn in the inorganic compounds (the same color code as for the spectra in Fig. 4). The error bars reflect step sizes of ±1 of the monochromator scan. For comparison, the peak-maximum positions of the Mn L3-edge spectra for PS II in the S1 (dark) state and the 2 F (illuminated) sample are shown in the expected average oxidation states (error bars of one bin width). Note that the Mn(II)Mn(III)2CaO(OH) (non-cubane, reduced) Mn3CaOx complex and the PS II samples exhibit mixed oxidation states (see main text), but only for the Mn3CaOx complex with two clearly separable Mn L3 peaks (see Fig. 4), two peak-maximum positions are given. The gray shaded area reflects the uncertainty of the linear fit.

