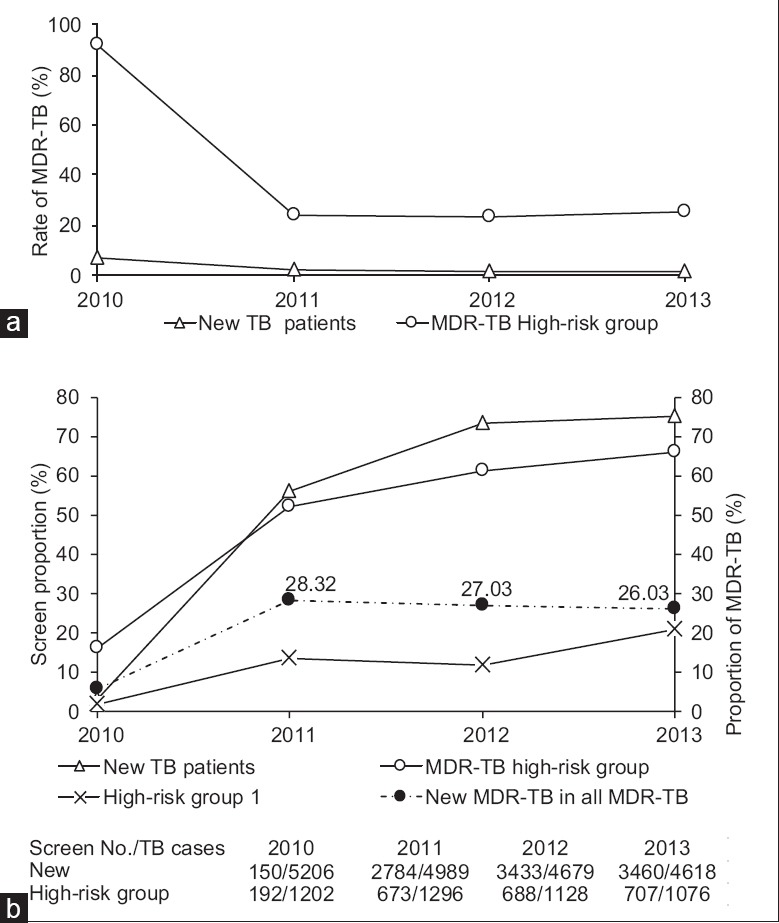
Figure 1.

(a) Multidrug-resistant tuberculosis cases in the new tuberculosis patients and high-risk group. (b) Screen proportion in the new tuberculosis patients and high-risk group, the red line shows the percentage of multidrug-resistant tuberculosis cases diagnosed from new tuberculosis case in all diagnosed multidrug-resistant tuberculosis cases. Group 1 refers to the group of new cases persisting sputum culture or smear positive at the end of the 2nd month after treatment.
