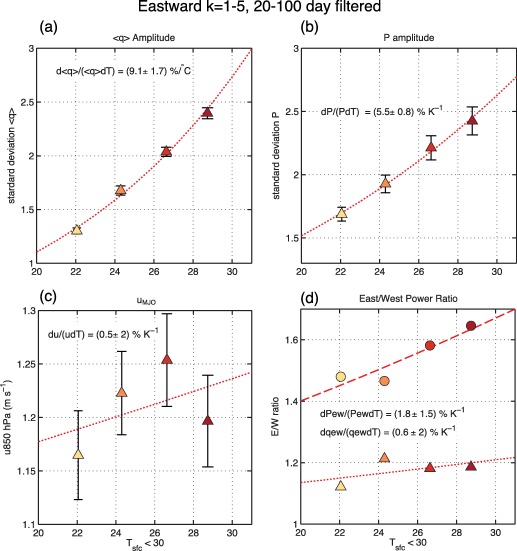
Figure 7.

Scatterplots showing NDJFMA, MJO‐filtered standard deviation of (a) column water vapor and (b) precipitation, and (c) 850 hPa zonal wind as a function of tropical surface temperature. All fields are averages over the warm pool (60°E–180°E, 10°N/S) (d) East‐west power ratio of precipitation (circles) and column water vapor (triangles) for the four GISS simulations. The east‐west power ratio is calculated as the ratio in spectral power between eastward‐propagating wave number averaged over zonal wave numbers 1–5 and 20–100 day time scales. The percentage‐based rate of changes is shown in the figure. The dashed line in each plot corresponds to the nonlinear least squares fit of the trend in each variable. Error bars correspond to the spread that arises from varying the zonal wave numbers retained in the MJO filter (varying from retaining zonal wave numbers 1–3 to 1–10) and from subsampling the time series.
