
Figure 9.
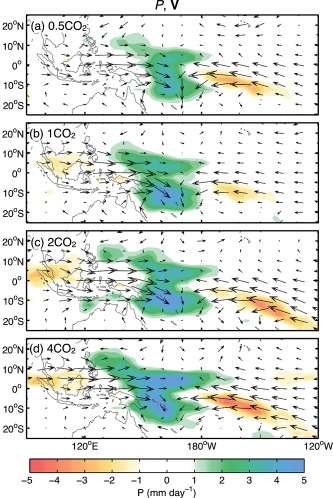
Linear regression for precipitation (shaded) and 850 hPa wind anomalies (arrows) onto an MJO‐filtered time series centered over the western Pacific. Each plot corresponds to the anomaly fields for the (a) 0.5CO2, (b) 1CO2, (c) 2CO2, and (d) 4CO2 simulations. The largest arrows correspond to wind anomalies of m s−1.