
Figure 11.
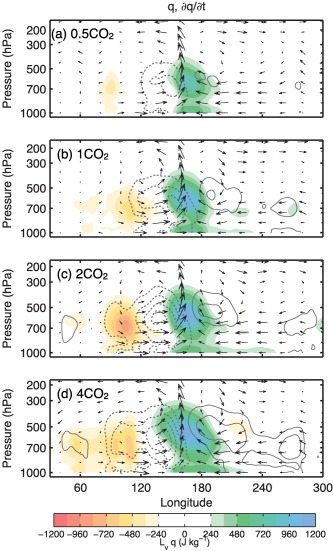
Composite longitude‐height cross section of latent energy anomalies (shaded), its temporal tendency and the anomalous zonal mass circulation for the (a) 0.5CO2, (b) 1CO2, (c) 2CO2, and (d) 4CO2 simulations. The largest zonal flux vector is kg m−2 s−1. Contour interval 30 J kg−1 d−1.