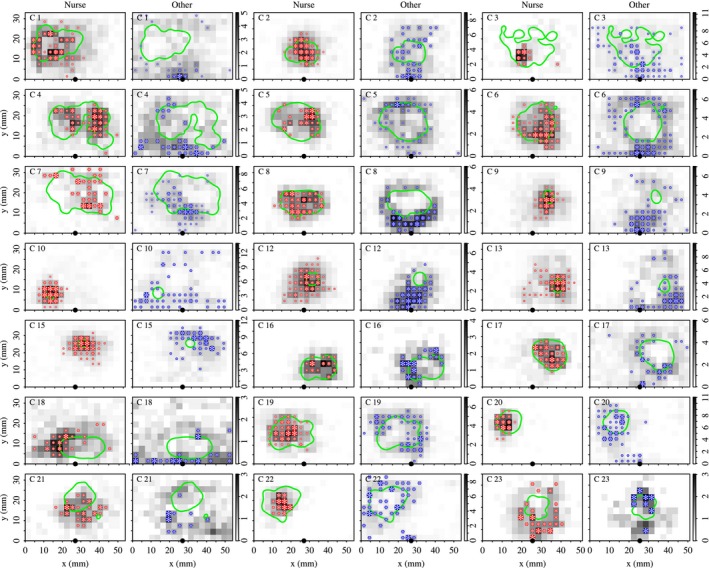
Figure 4.

Within‐community space use maps for the 21 colonies that had two communities. Site greyscale indicates the number of times ant i visited the site, , averaged across all community members. Asterisks indicate important sites for community members; those that received significantly more visits than the null model expectation. Asterisk size is proportional to the number of community members for which the site was classified important. The black point on the x‐axis indicates the nest entrance. The green line indicates the edge of the brood pile.
