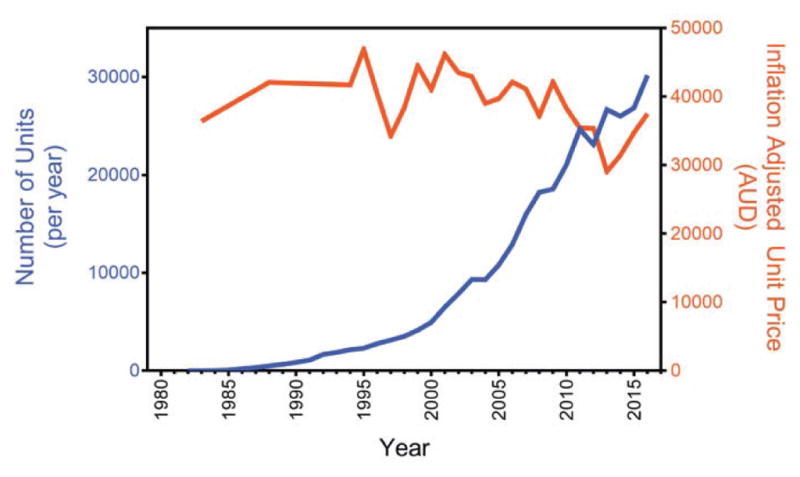
Fig. 3.

Contrast between cochlear implant volume and price. The number of annual cochlear implants sold by Cochlear Corporation (blue line with units on the left y-axis) and the unit price (orange line with units on the right y-axis) is plotted as a function of year. The unit price was estimated by dividing the annual revenue by the annual volume and had been adjusted for inflation according to 2016 Australian (AUD) dollars. Data from 1994 to 2016 were extracted from Cochlear Annual Reports (http://www.cochlear.com/wps/wcm/connect/intl/about/investor/annual-reports). Earlier data were extracted other sources [11].
